Tractivvity · Feature guide · Gran Turismo 7
Analyze
The page where the work happens, read left to right.
Analyze — where the work happens
Everything else feeds this page or points back at it. It is where you look at one lap in full detail, put it next to another, and find the tenths hiding in the corners. If you only ever use one part of Tractivvity, it is this one.
Reading the page, left to right
Analyze is a single screen with four columns, and it rewards knowing what each one is for. From the left: Lap Info, the track map, the data chart, and a collapsed Controls drawer. Tractivvity Insights opens over the left column on demand.
This section works across that page one column at a time, starting at the far left.
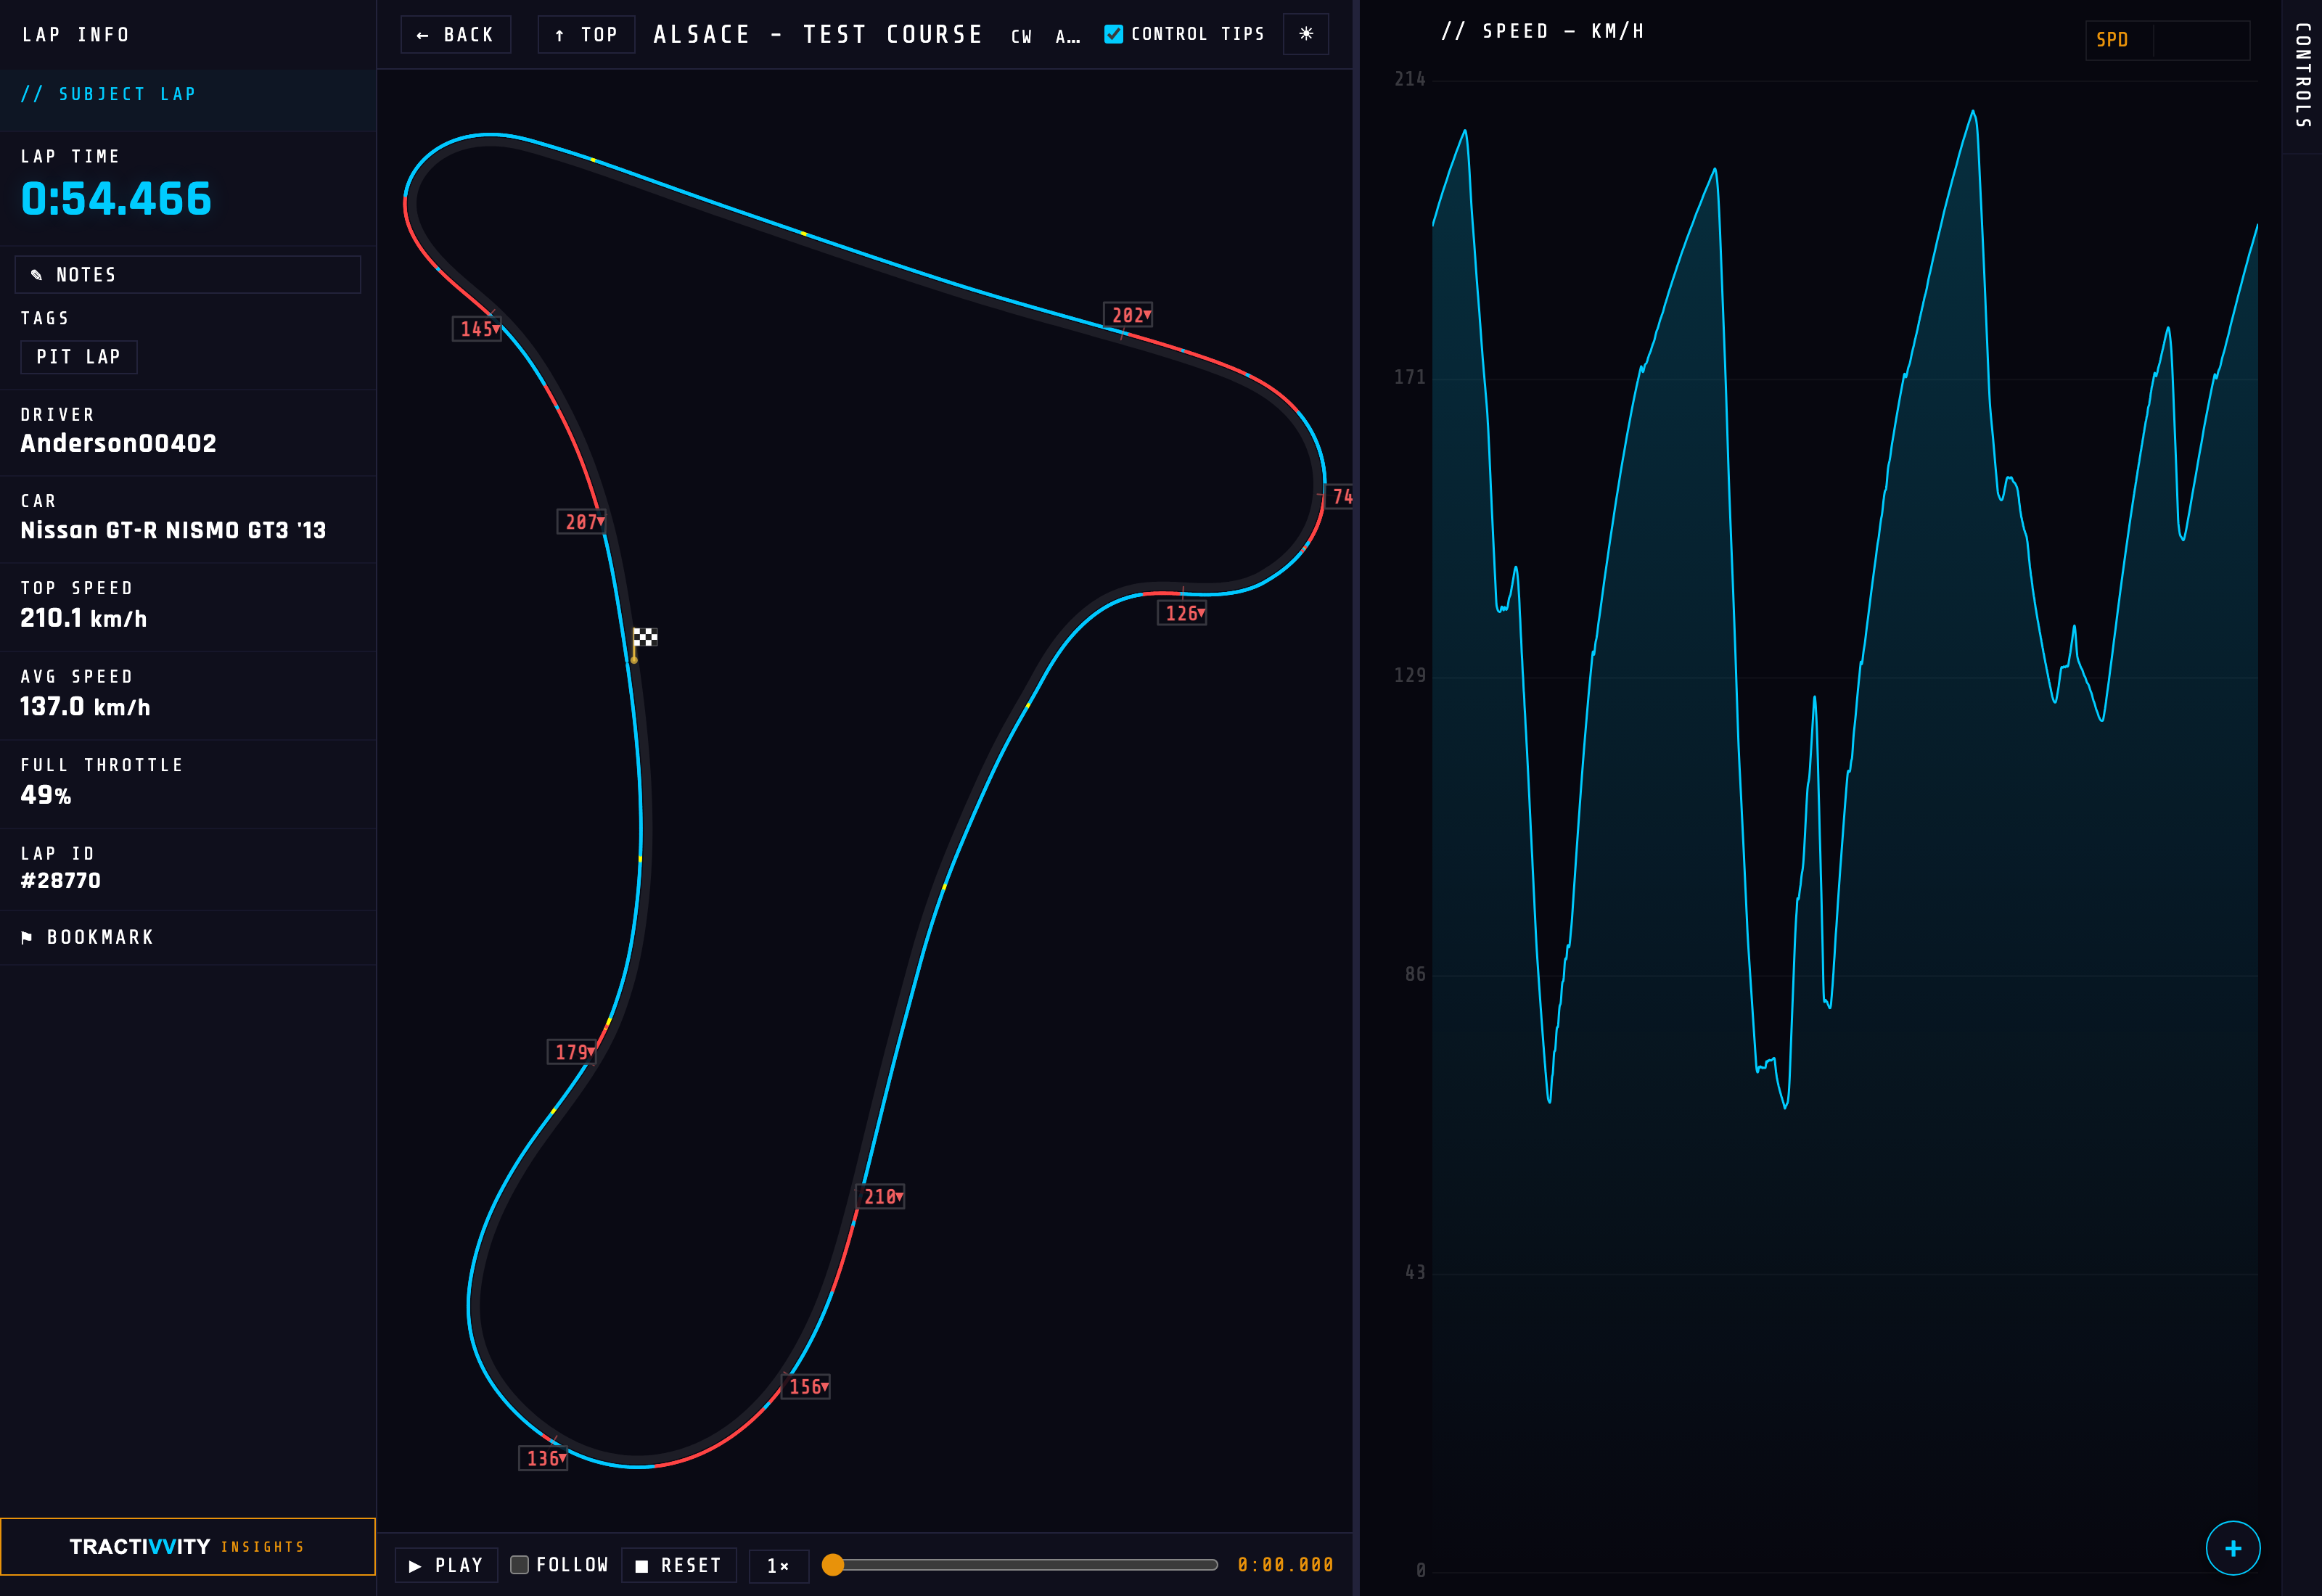
Column one — Lap Info BASIC
The panel that tells you what you are looking at. It collapses to a vertical tab when you want the map to have the room, and everything in it is either a fact about the lap or a way out of the page.
| Field | What it gives you |
|---|---|
| Lap time | The headline. A first lap on a circuit is marked as such, so you are not comparing a sighting lap to a flyer without noticing. |
| Notes | A free-text note on the lap, editable in place and saved without leaving Analyze. Use it for what the car was doing, what you changed, or why the lap was scruffy. Only on your own laps. |
| PP | A number you type in, alongside the note — not something Tractivvity reads. See below. |
| Tags | What the system worked out by itself — PIT LAP and friends. Tags are why invalid laps stay out of leaderboards without you policing it. |
| Invalid | If the lap was thrown out, it says so here and gives the reason, rather than the lap simply going missing. |
| Driver | Who drove it, and a link straight to their profile. |
| Car | What it was driven in, linking to that car's page — where every other lap you have turned in it is waiting. |
| Top speed | Highest speed reached on the lap, in your units. |
| Avg speed | Average across the lap. Read against top speed it tells you whether the lap was fast or merely fast somewhere. |
| Full throttle | The percentage of the lap spent at 100% throttle. One of the quickest reads on whether you are committing. |
| Lap ID | The lap's number in the system — what you quote when you want somebody to look at exactly this lap. |
| Bookmark | Flags the lap so it surfaces in the bookmarked filter on My Telemetry. The cheap way to build a shortlist. |
The PP box sits inside the notes panel on your own laps, and it is there for you to fill in. Tractivvity does not know the figure: the telemetry stream does not carry it, and while every car has a stock Performance Points value, tuning moves it dramatically — so the stock number would usually be wrong.
Recording it yourself is what makes a lap comparable later. Two laps at the same PP were a fair fight; two laps two hundred PP apart were not, and nothing else on the page will tell you that.
Column one, with two laps — the compare block BASIC
Bring a second lap in and Lap Info does not get replaced — it grows a second half. A Compare Lap block appears underneath the subject lap, carrying the identical set of fields for the other lap, so you are reading like against like.
- The lap time carries the delta. Not just 0:54.870 but +0:00.404 against the lap above it, coloured and arrowed by direction. You learn the size of the problem before you have looked at a single chart.
- A different-car warning appears if the two laps were not set in the same machinery — because a four-tenth gap between two different cars is not the same finding as four tenths between two of yours.
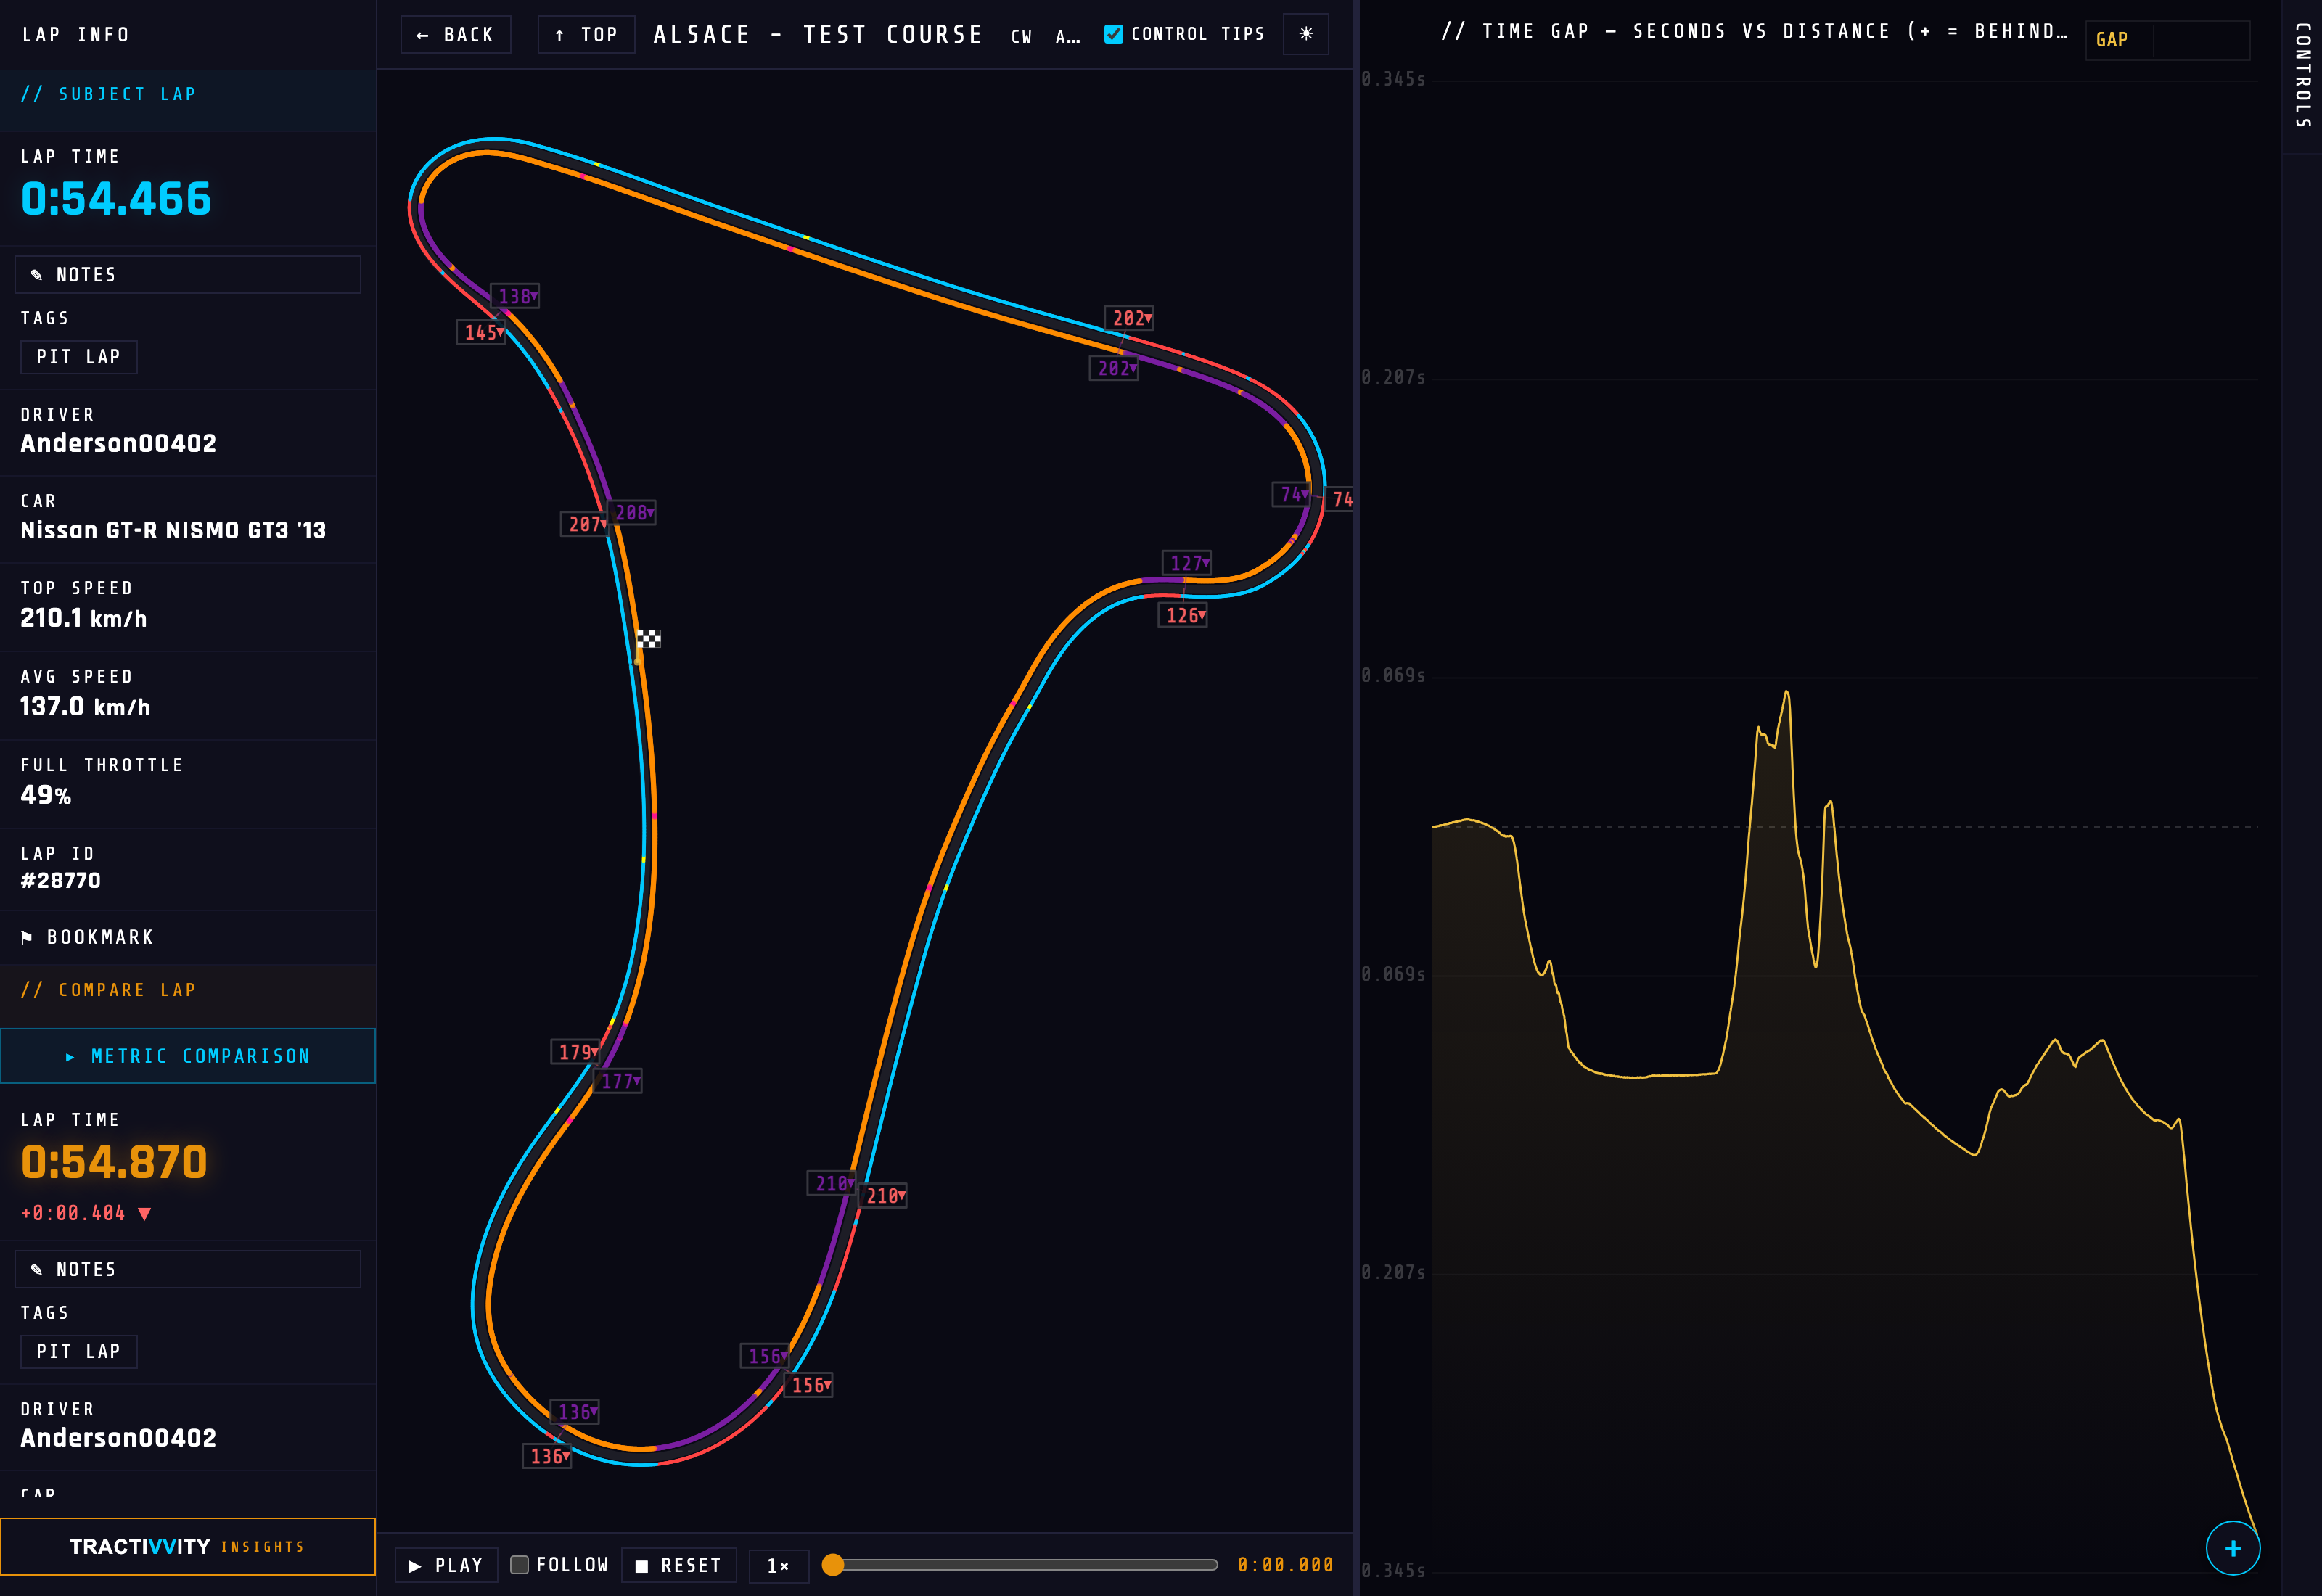
Metric Comparison BASIC
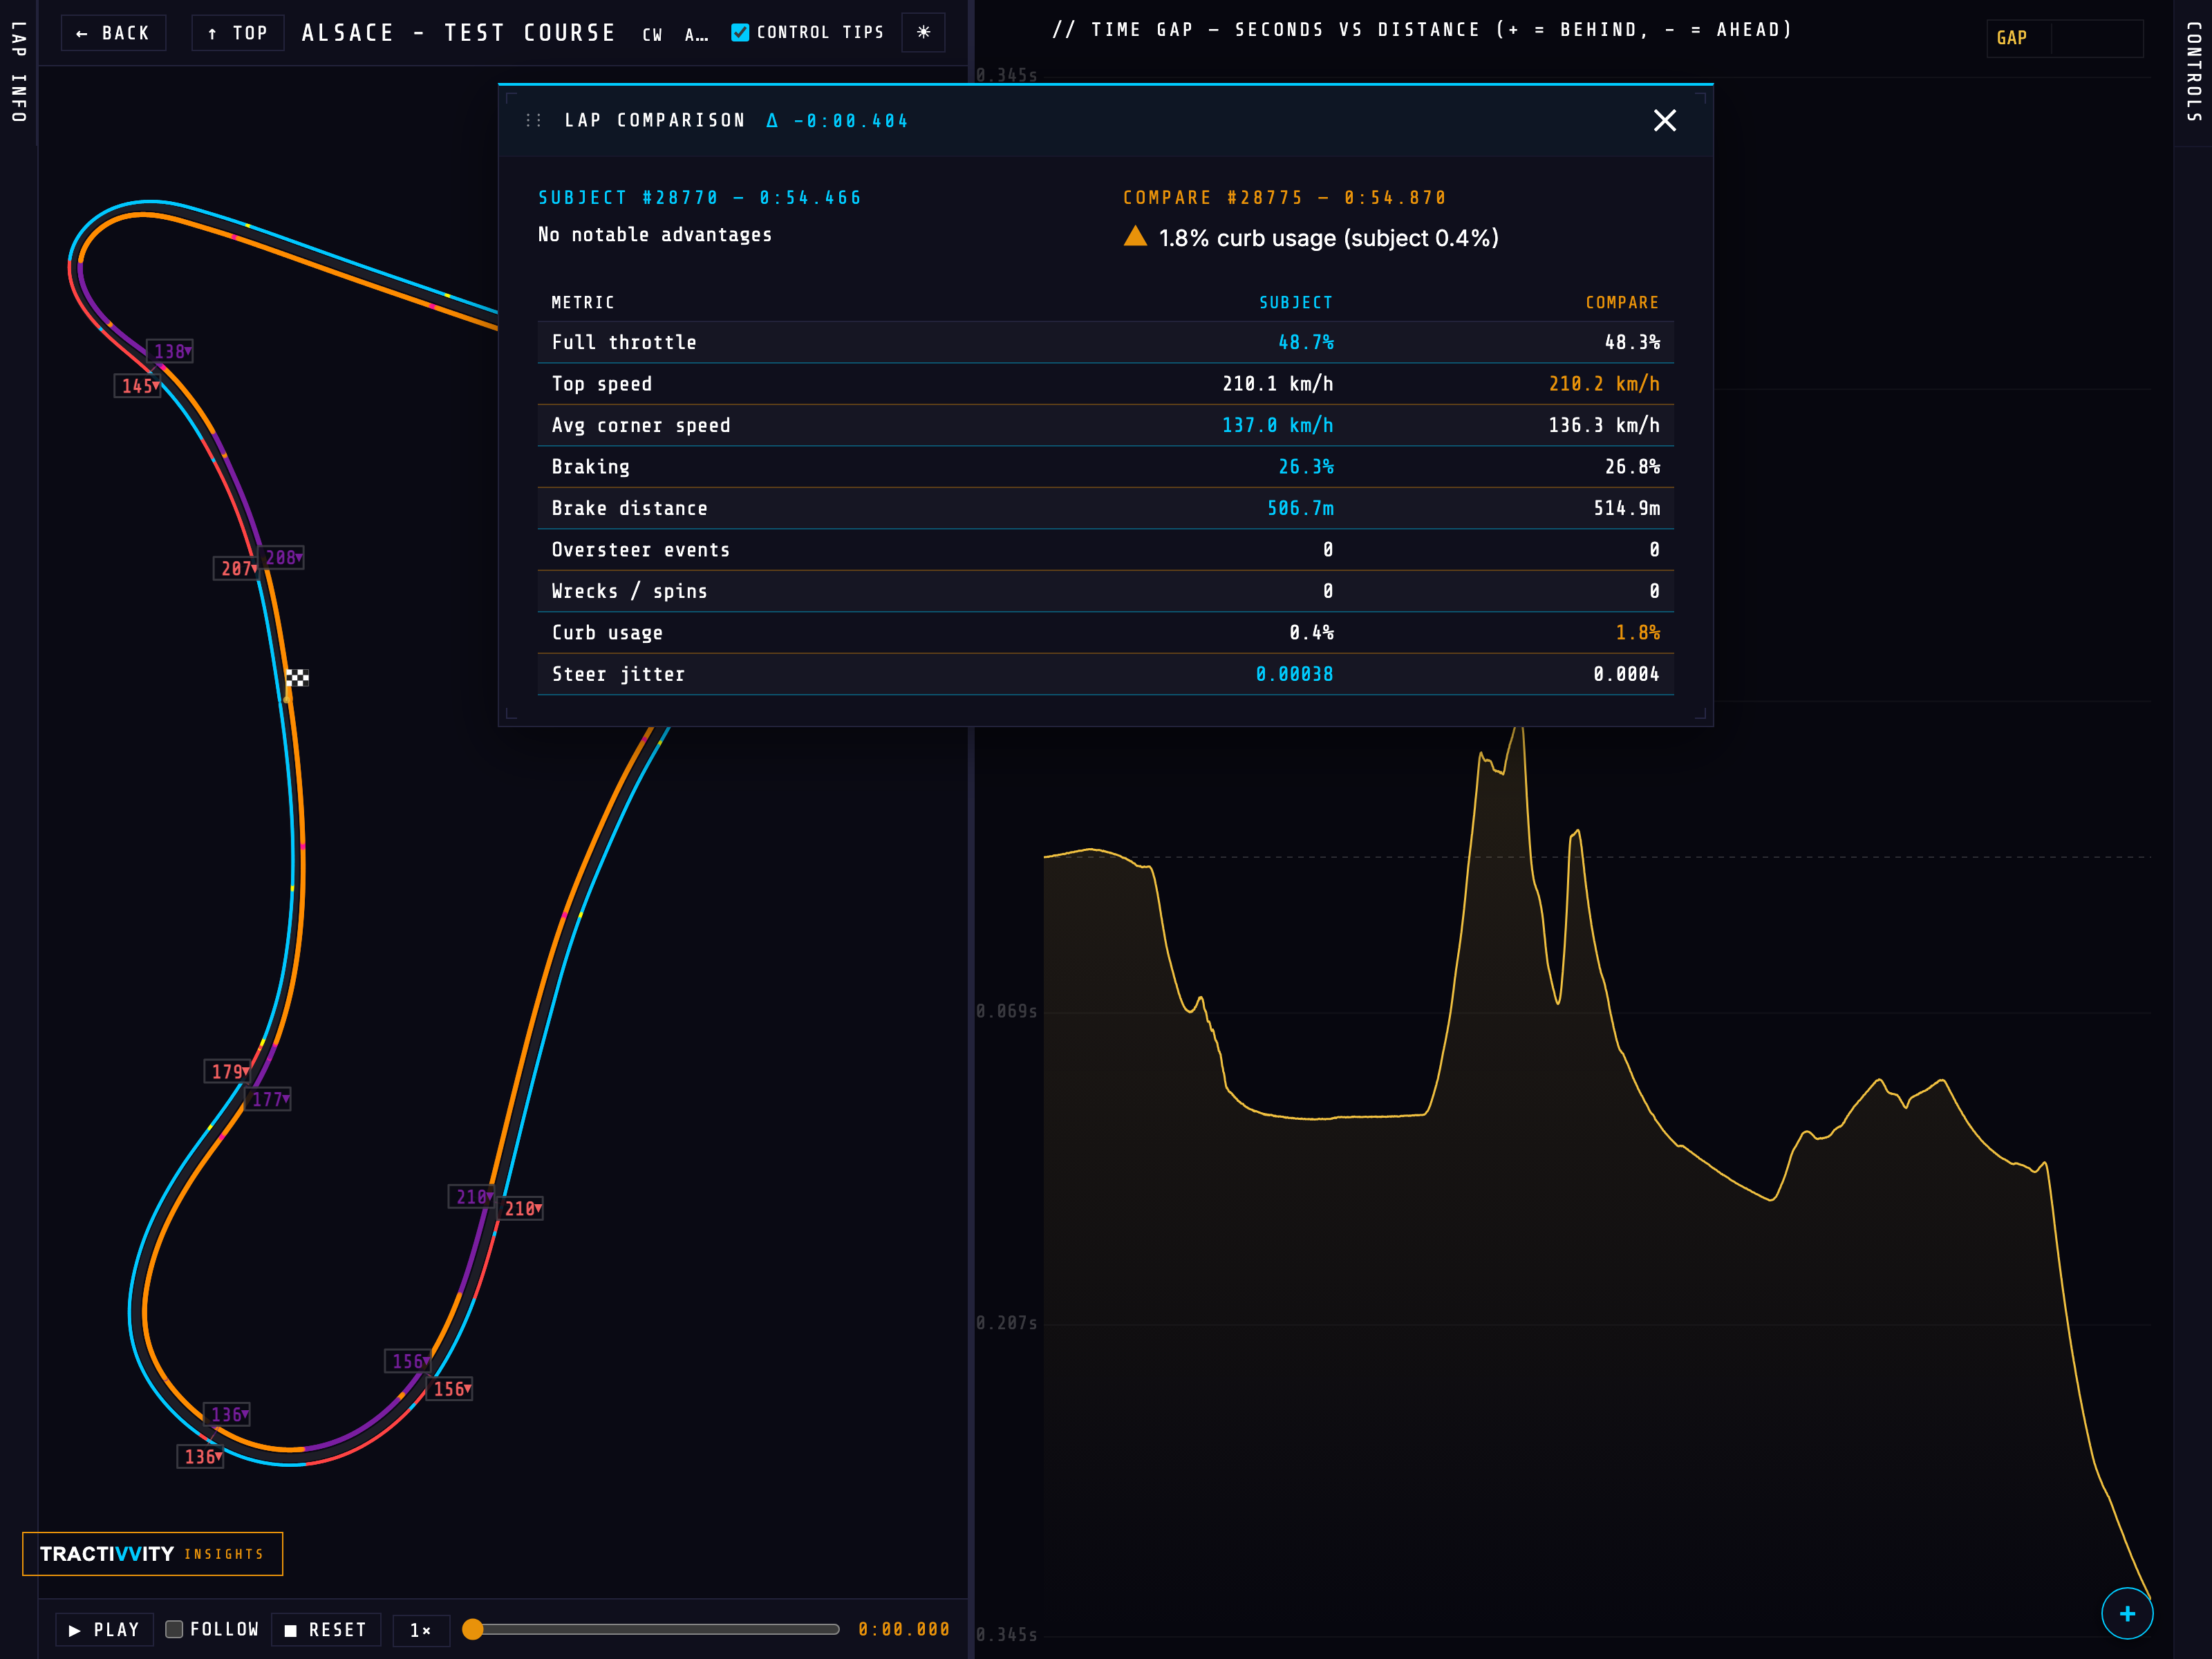
At the top of the compare block sits ▸ Metric Comparison. It opens a draggable panel over the page giving a side-by-side breakdown of the two laps — the numbers that the sidebar does not have room for.
It opens with a verdict on each lap rather than only a table: a short line per side naming where that lap had the advantage, and a flag against anything worth worrying about. In the example below the subject lap has no notable advantages, while the compare lap is carrying 1.8% kerb usage against the subject's 0.4% — which is the real story of that lap, and not something you would spot by reading nine rows of numbers yourself.
Underneath, the metrics line up three columns wide — metric, subject, compare — with the better value of each pair picked out in colour:
| Metric | What a difference here means |
|---|---|
| Full throttle | Percentage of the lap at 100% throttle. Commitment, in one number. |
| Top speed | Highest speed reached. Usually a straight-line or exit story. |
| Avg corner speed | Where most lap time actually lives. A gap here is worth more than a gap in top speed. |
| Braking | Percentage of the lap spent on the brakes. |
| Brake distance | Total metres under braking. Read with the above: more distance at similar percentage means earlier, softer stops. |
| Oversteer events | Counted moments where the rear stepped out. |
| Wrecks / spins | The lap-ruining incidents, counted. |
| Curb usage | How much of the lap was spent on the kerbs. Free time, or a lap about to be invalidated. |
| Steer jitter | How busy the hands were. High jitter is usually correction, and correction is usually slow. |
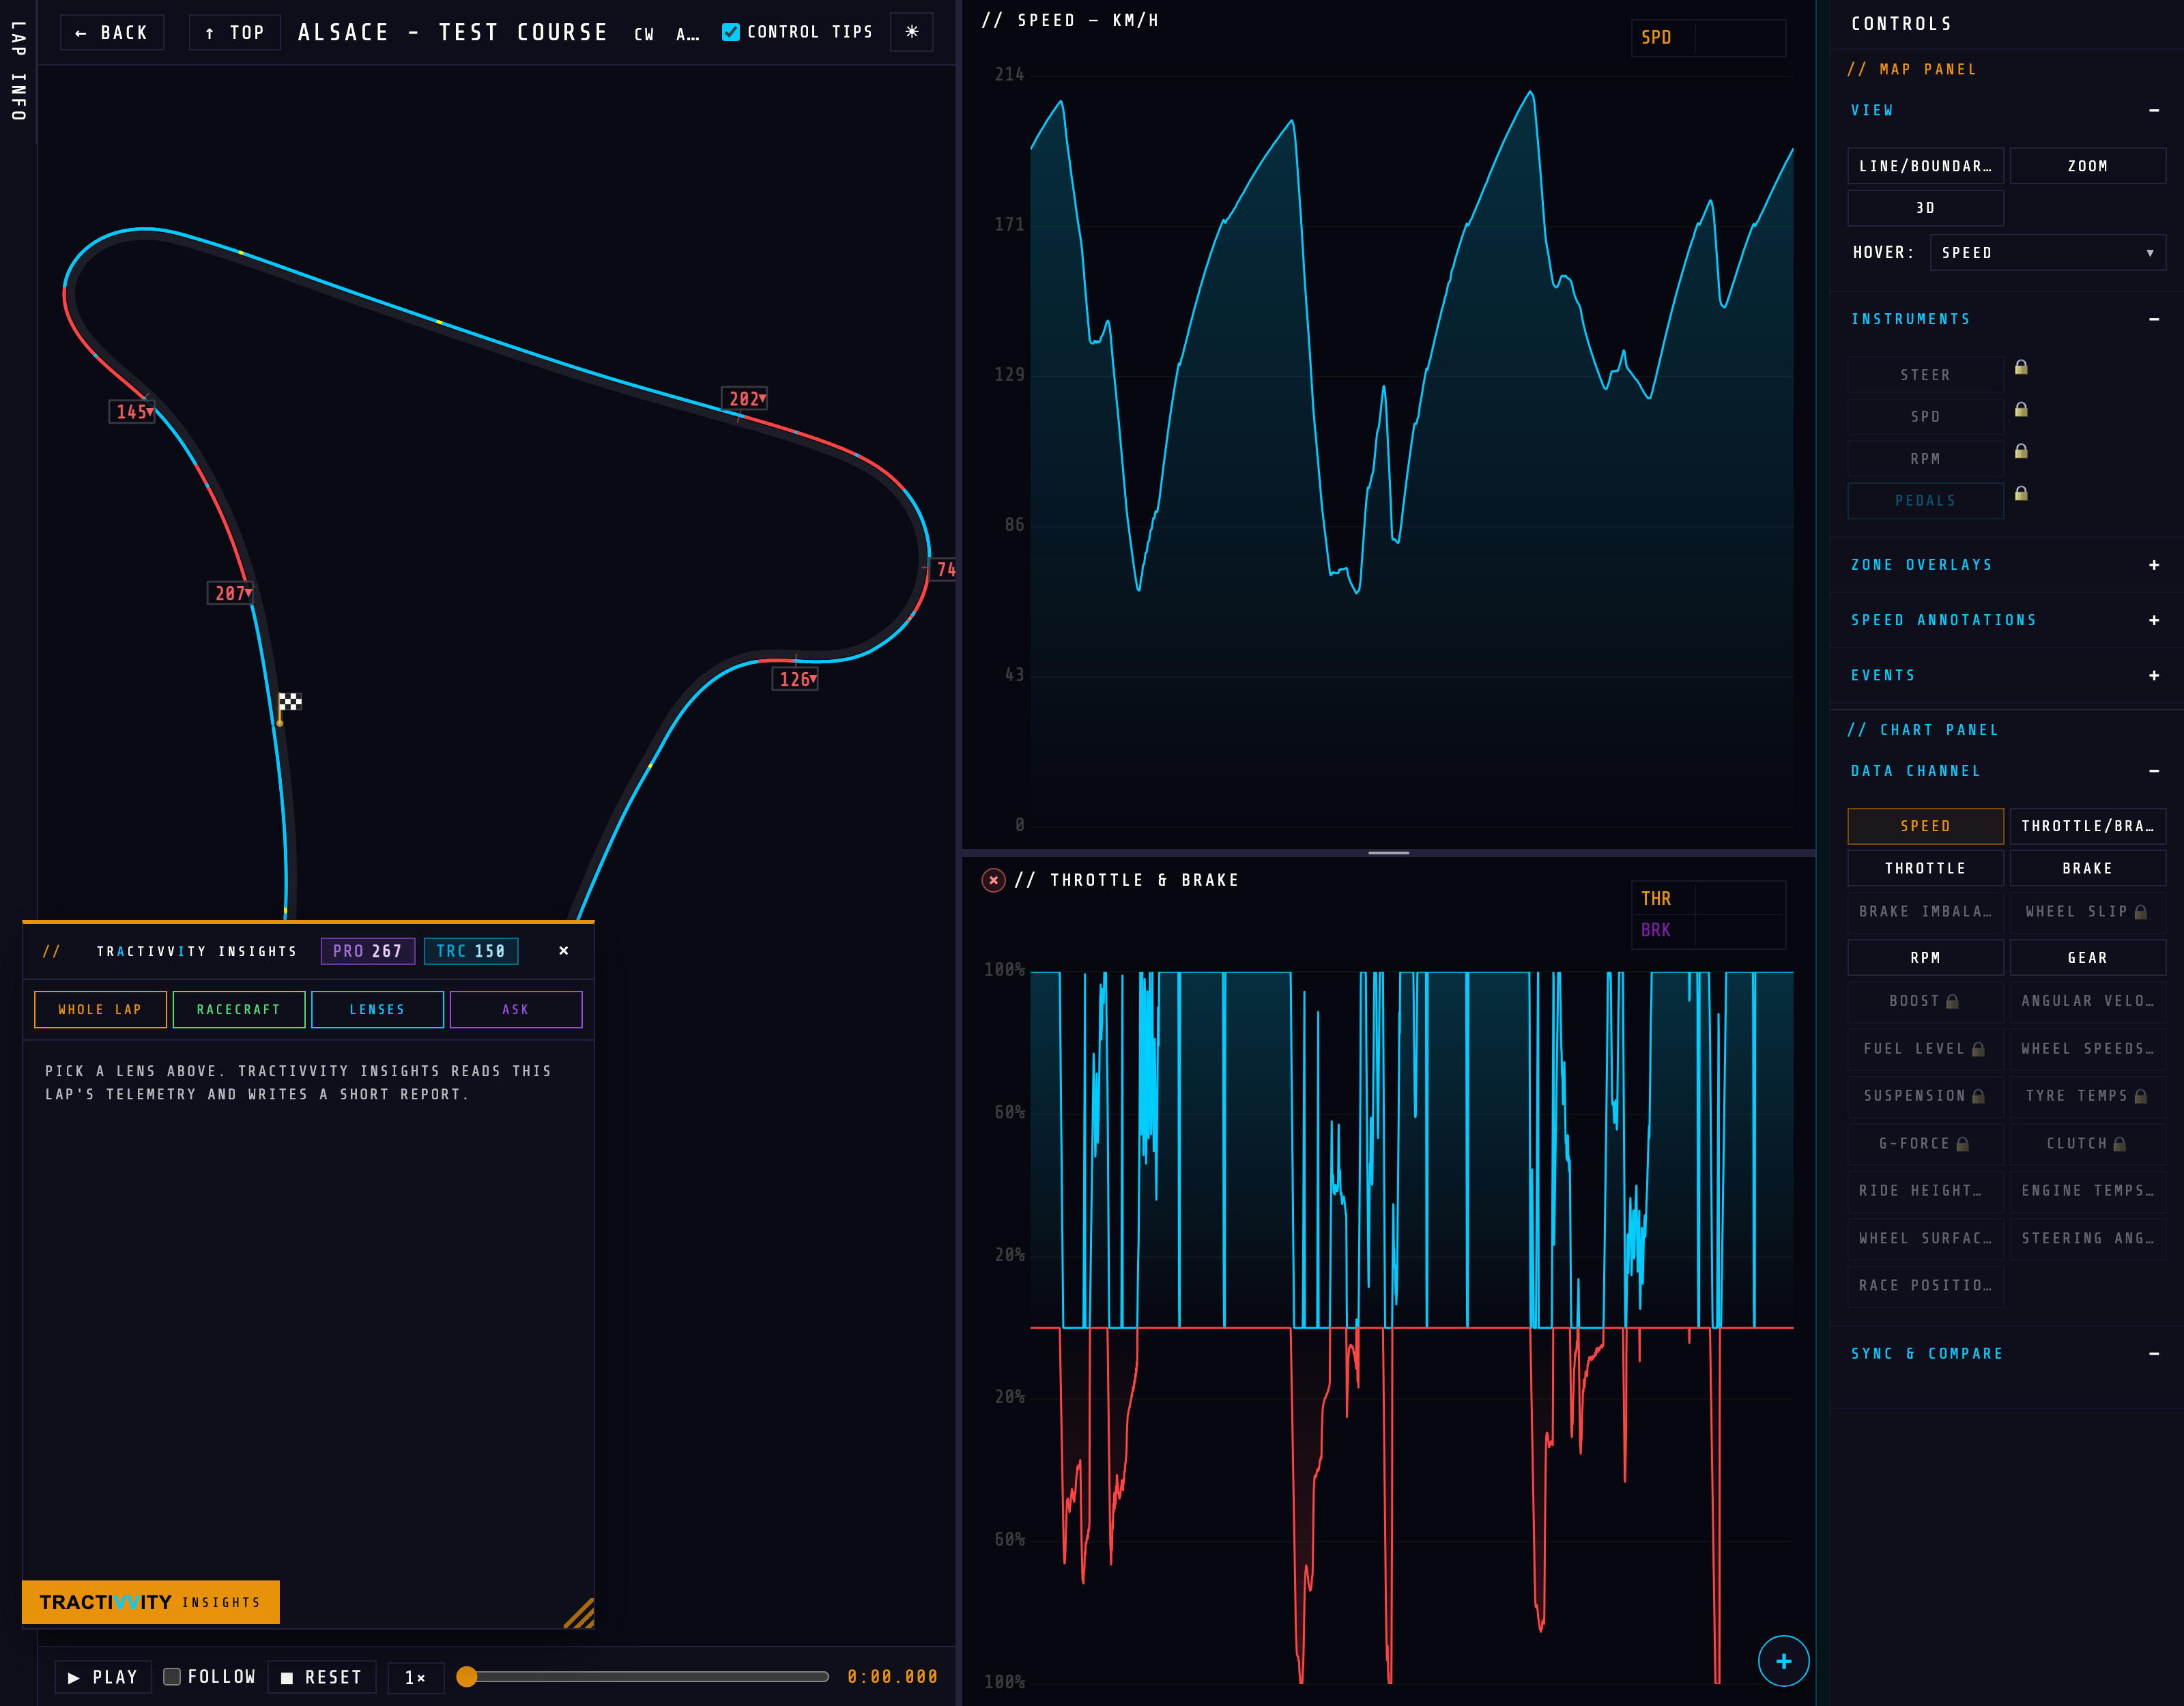
Over the top — Tractivvity Insights BASIC
This is the first place in the product you meet Tractivvity Insights, and it is worth stopping on. Open it from the button at the foot of the left column and it slides over Lap Info as a panel of its own.
Insights is the AI reading of the lap you are looking at. Not a chart to interpret — a short written report about this specific lap, produced on request. It offers four ways in:
The overall read
Takes the lap end to end and reports what stands out — where time went, what was good, what to look at next.
Technique, checked
Scans the lap for the techniques taught in the Racecraft lessons, charts where each one happens, and says what to fix and what to keep.
One channel at a time
Point it at brakes, throttle, steering, G-force, suspension, tyre temps, gear, sectors, the racing line, incidents — and get that channel read properly rather than left to you.
Your own question
For when the thing you want to know is not one of the above. Ask it about the lap in your own words.
What it costs, and how the two balances work
Insights runs on credits, and the panel header shows what you have in two pills:
| Pill | What it is |
|---|---|
| PRO | Your monthly Pro subscription allocation. Spent first, and it refreshes each month. |
| TRC | Tractivvity Insights credits — bought or granted. These never expire, so they sit behind the monthly allowance as reserve. |
Spending order is deliberate: the allowance that would otherwise lapse goes first, and the credits you paid for stay put until you actually need them. Accounts with unlimited access see ∞ instead of a balance.
Seeing two laps — Split BASIC
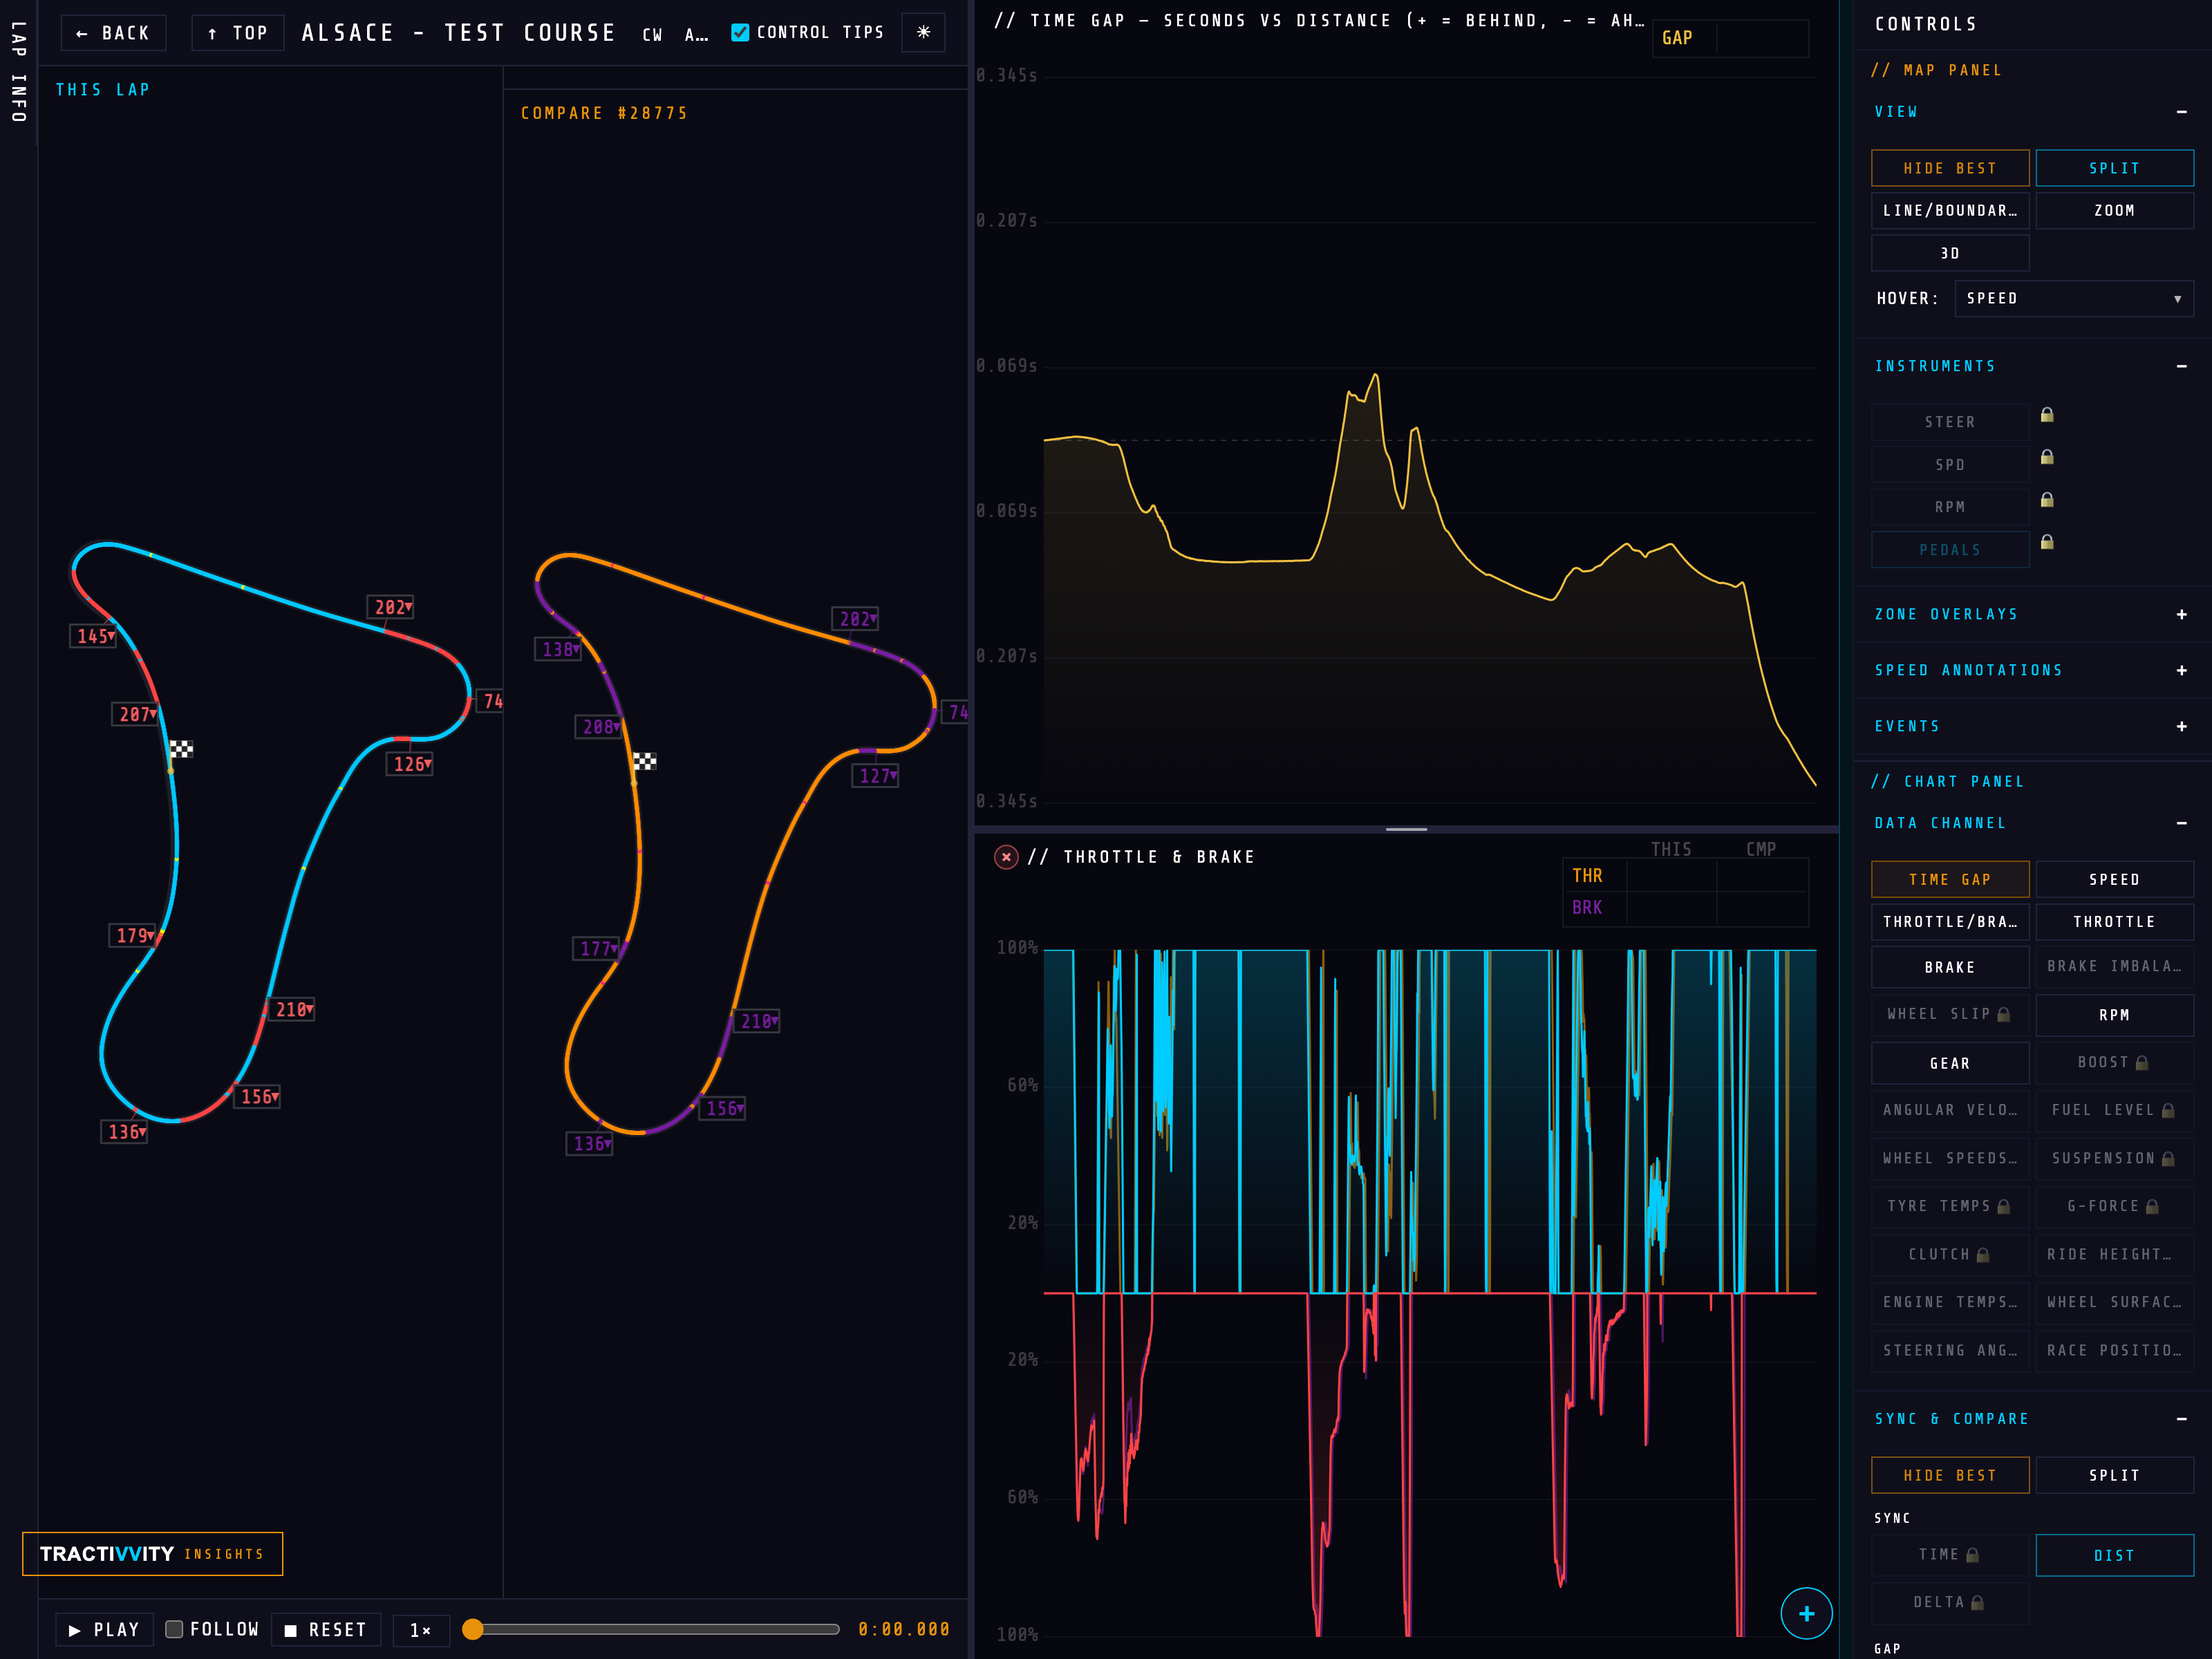
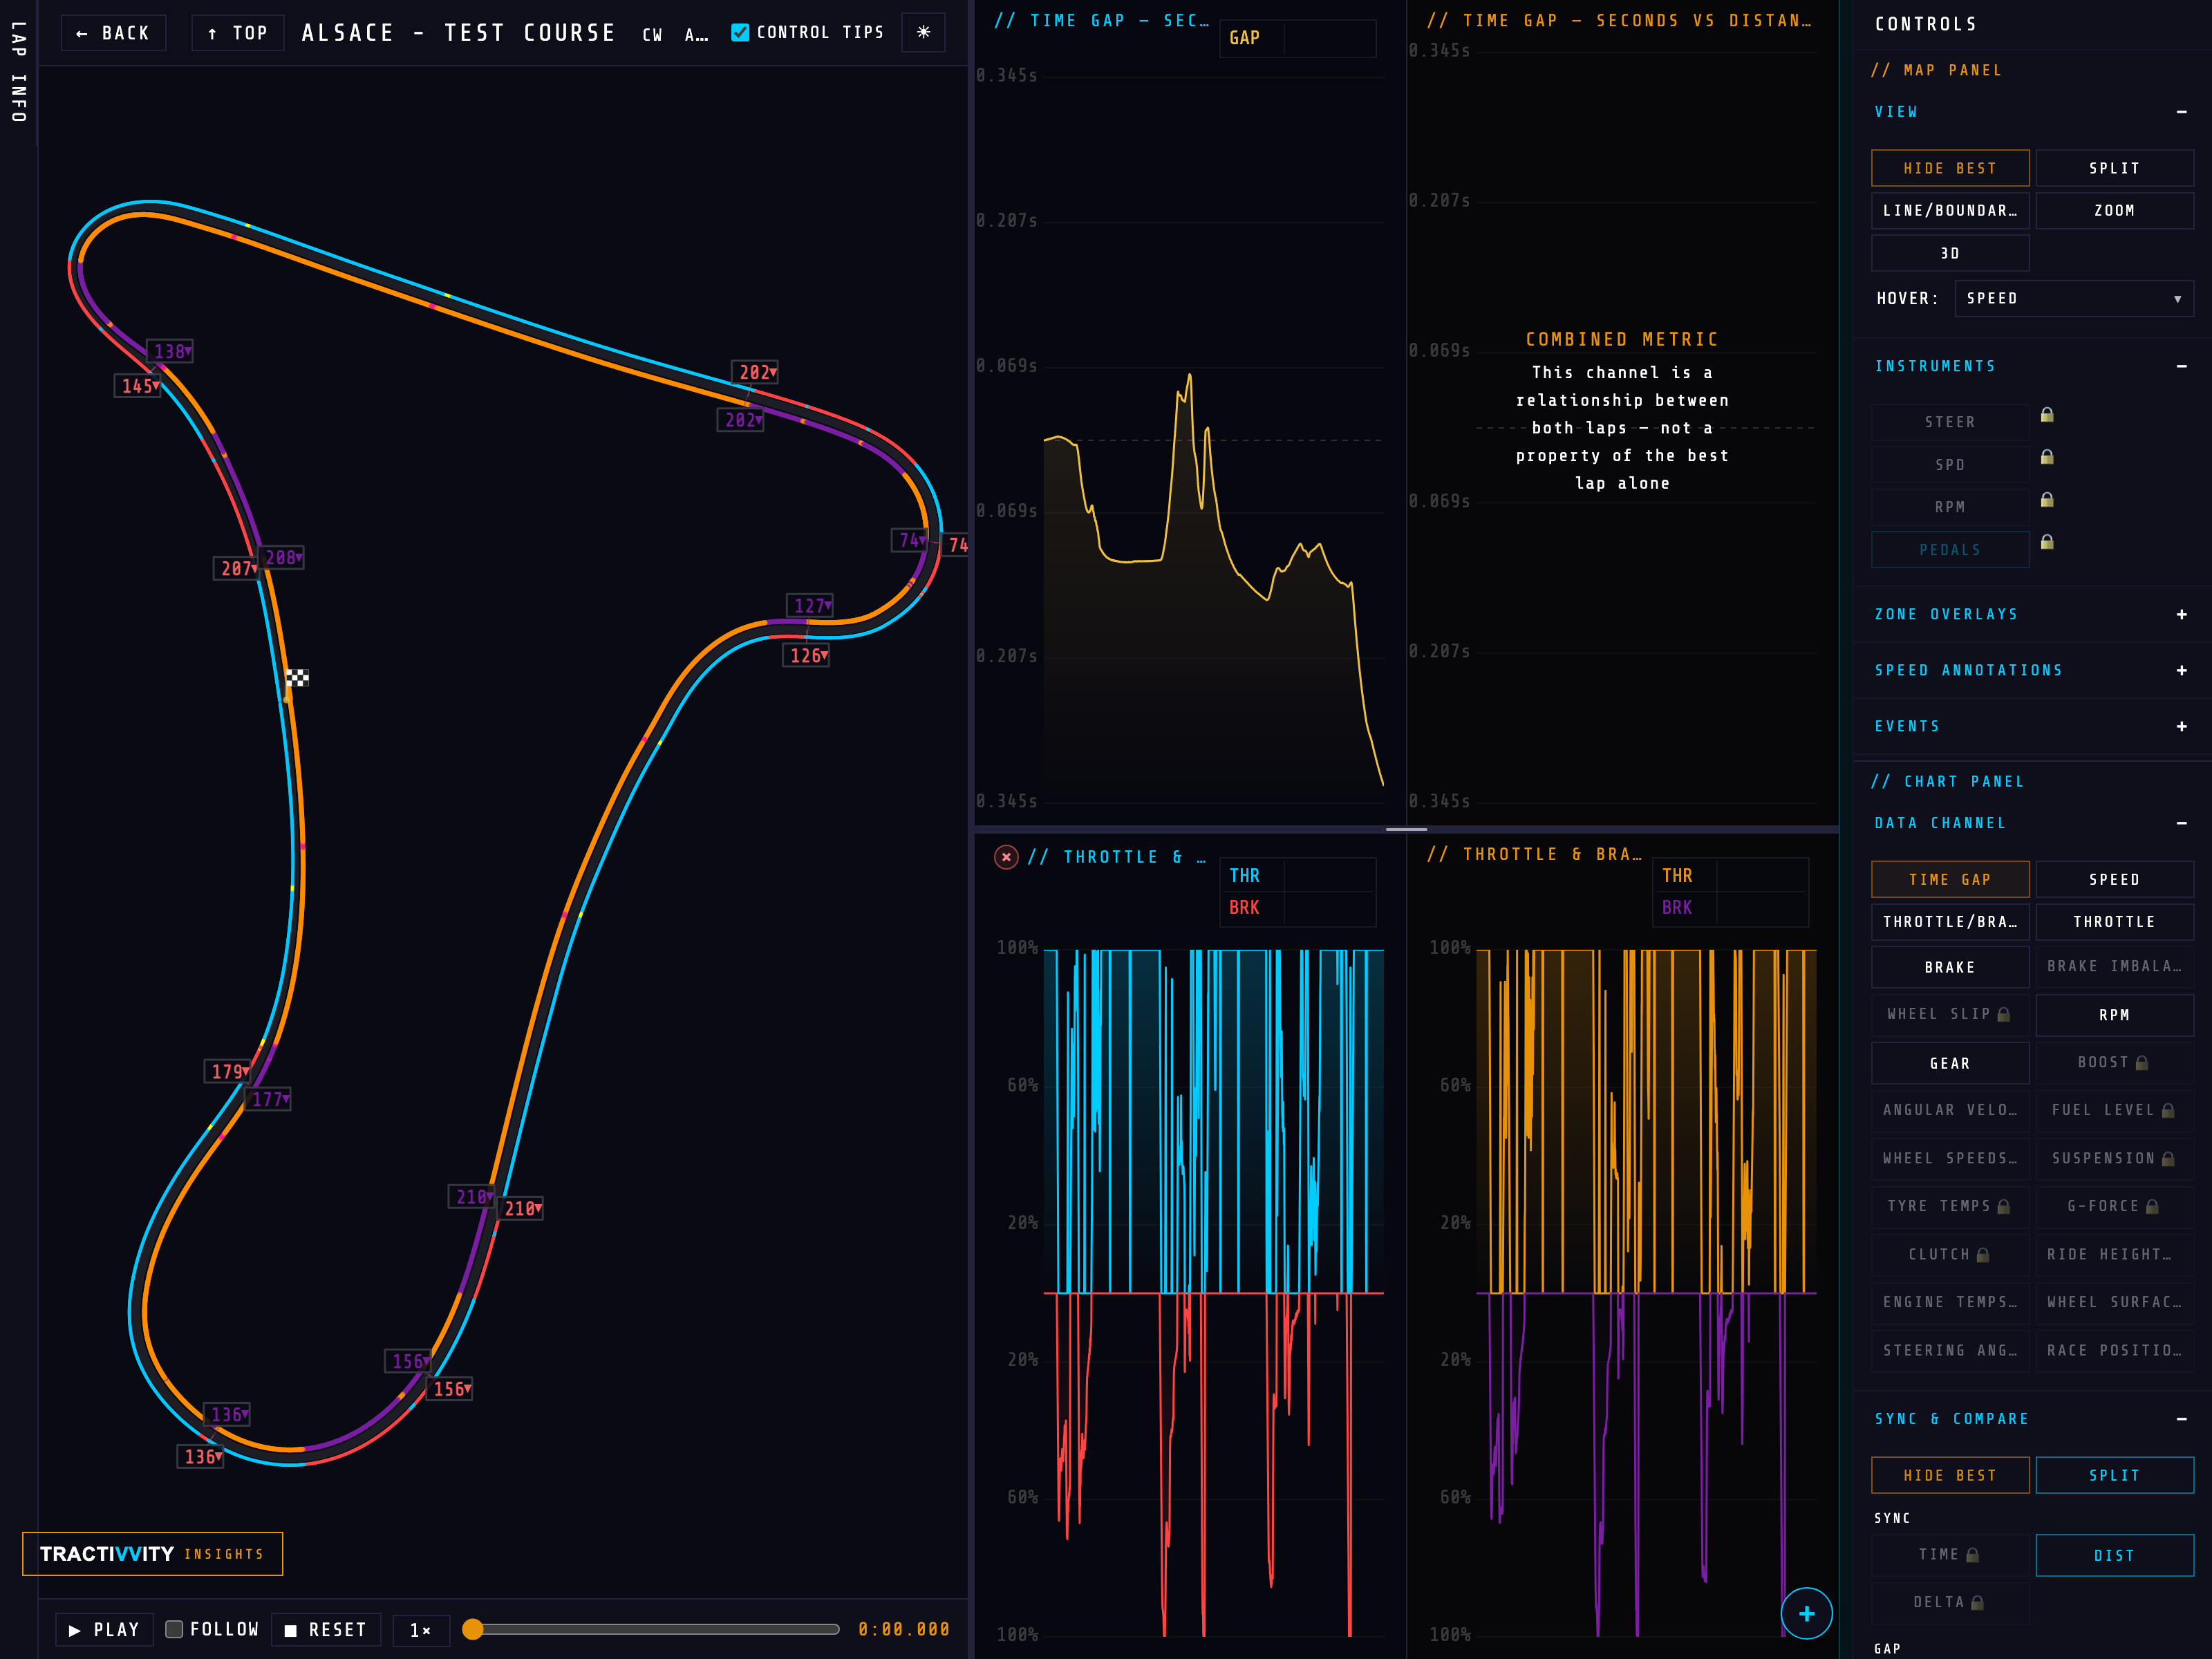
Overlaying two laps is the default, and for most questions it is the right one. But two lines on one canvas hide each other, and at some point you want to see each lap on its own terms. That is what SPLIT is for, and there are two of them — one for the map, one for the charts — because you rarely want both at once.
Both appear only when a compare lap is loaded, alongside HIDE BEST, and both are open on a free account.
Split the map — left and right
The middle column divides in two: THIS LAP on the left, COMPARE #28775 on the right, each drawn on its own copy of the circuit in its own colour. Corner speeds print on both, so you read the same corner twice rather than trying to untangle two labels stacked on one apex.
Split the charts — the same, one column over
The other Split does it to the data instead. Every stacked row divides down the middle, your lap's trace on the left and the comparison's on the right, for as many channels as you have stacked. The map stays overlaid so you keep the line comparison while the numbers separate.
Columns two and three — playback BASIC
The map and the chart are not two separate readouts. They are one readout drawn twice, and the thing that makes that obvious is pressing play.
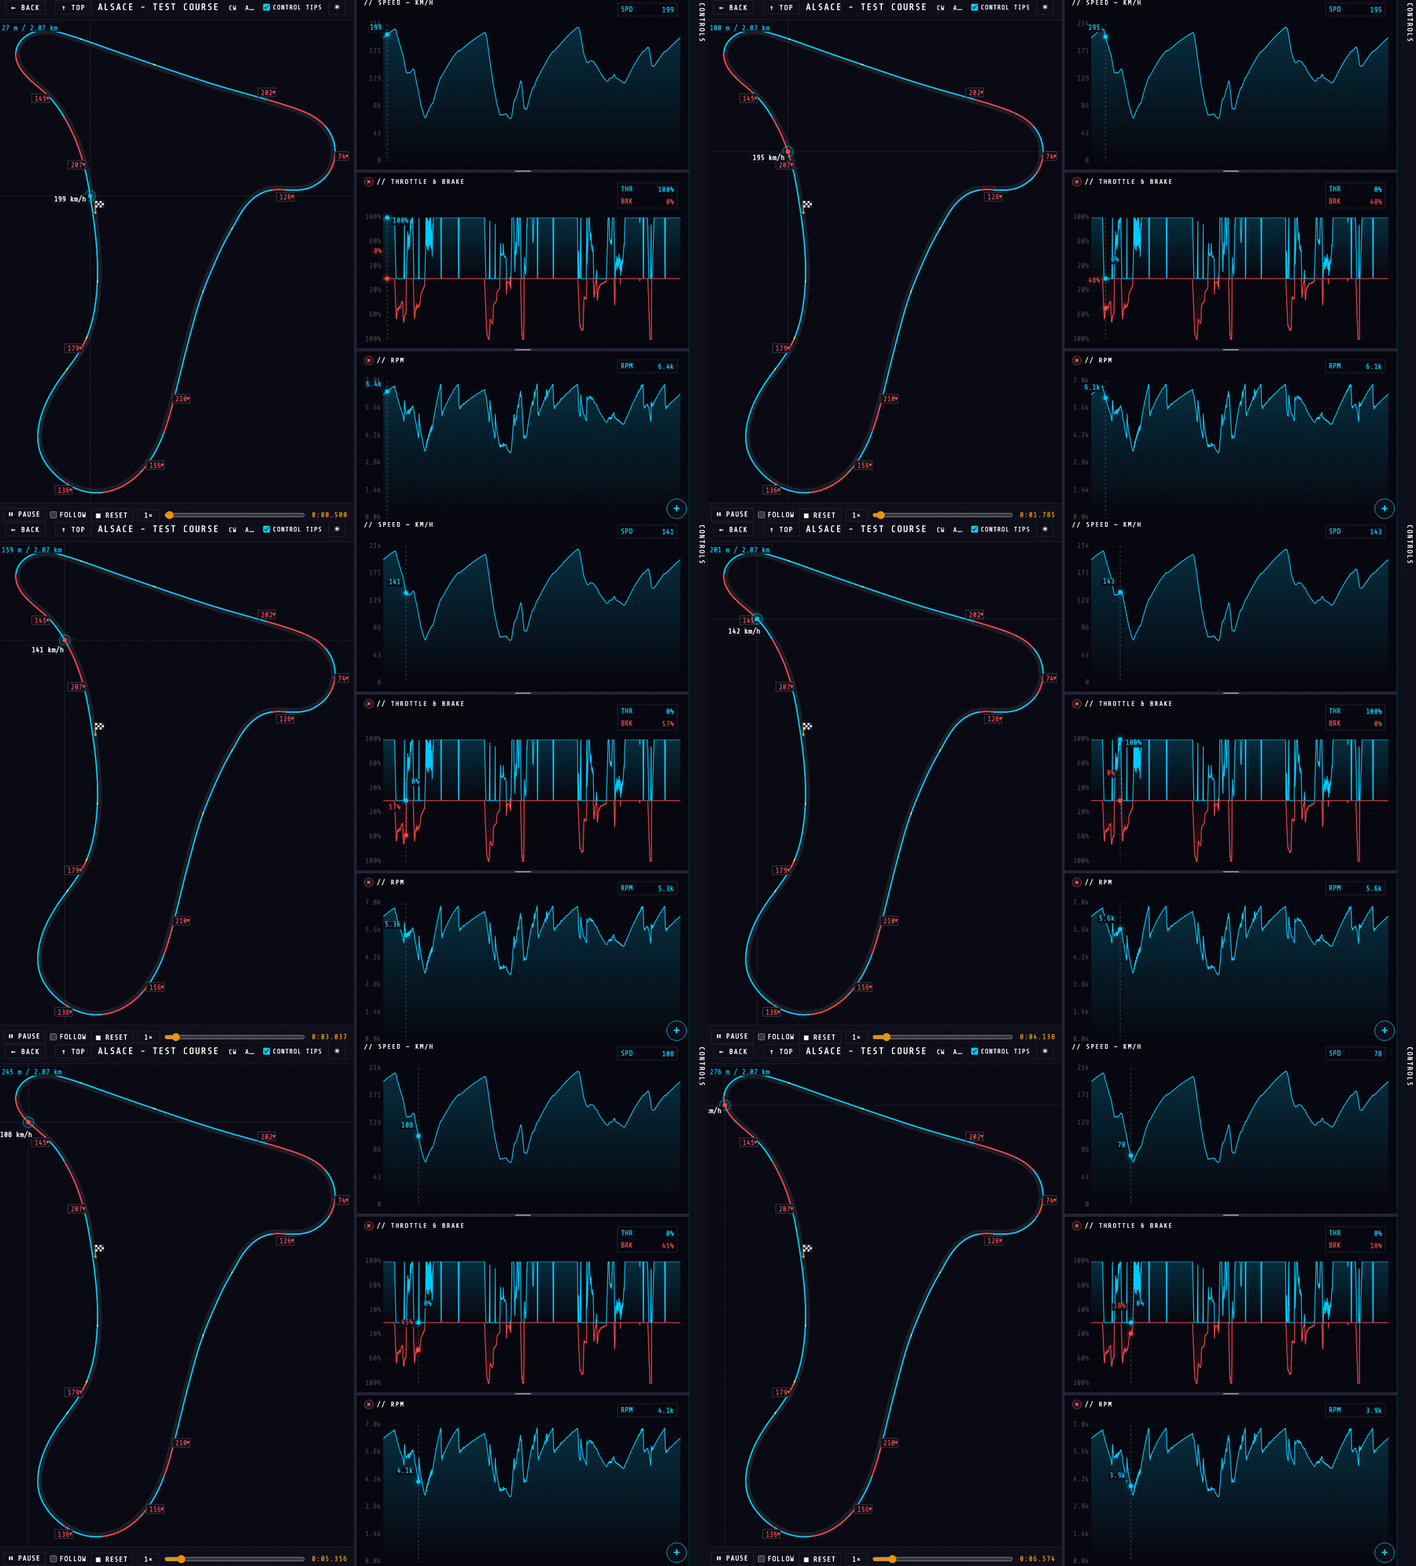
The transport sits under the map: PLAY, FOLLOW, RESET, a speed multiplier and a scrubber you can drag to any point in the lap. Start it and the lap replays from the telemetry — not video, the actual recorded samples played back in order.
Three things are worth noticing while it runs:
- The two columns are locked together. The marker on the map and the cursor on the chart are the same instant. Scrub to a corner and the chart is already showing you that corner; find a spike on the chart and the map has already told you where it is.
- The marker carries its own numbers. Distance into the lap, and the value of whatever channel you have set as HOVER — speed by default. You can read the lap without looking away from the circuit.
- Every stacked row moves with it. One cursor runs through all of them at once, each row printing its own value at that instant — which is where reading braking against speed against RPM stops being three separate exercises and becomes one.
Follow, with a lap to chase
FOLLOW pins the camera to the car instead of showing the whole circuit, and zooms in. On its own that is a nicer replay. With a compare lap loaded it becomes the most direct answer the page can give you, because now there are two cars on screen at the same point on the track and you can watch the gap open and close between them.
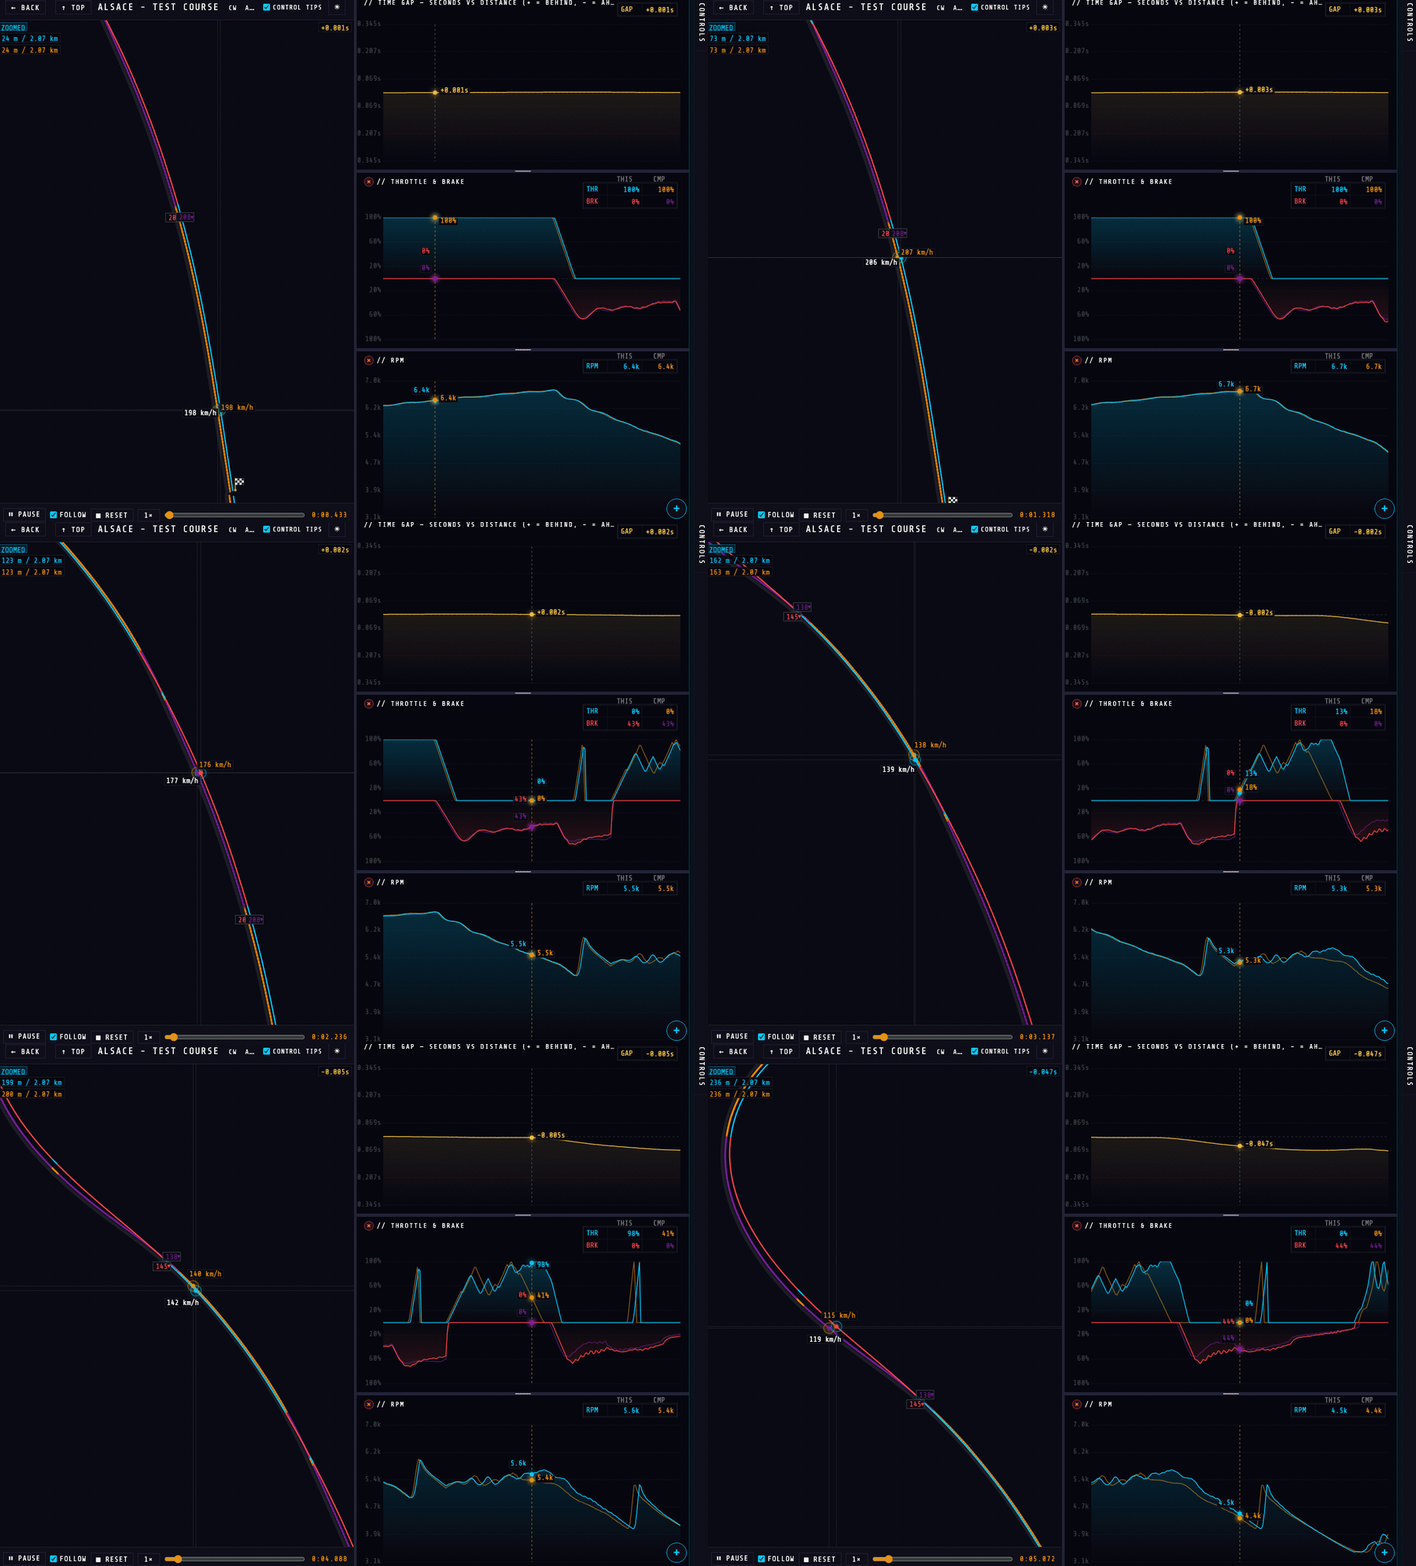
That is the whole argument for syncing by distance rather than by time. Both cars are always at the same point on the track, so every difference you see — speed, line, gap — is a difference in how the corner was driven, not an artefact of one car being further round the lap than the other.
The speed multiplier runs playback slower for a corner you are picking apart, or faster to get to the part you care about.
Column four — the Controls drawer BASIC PRO
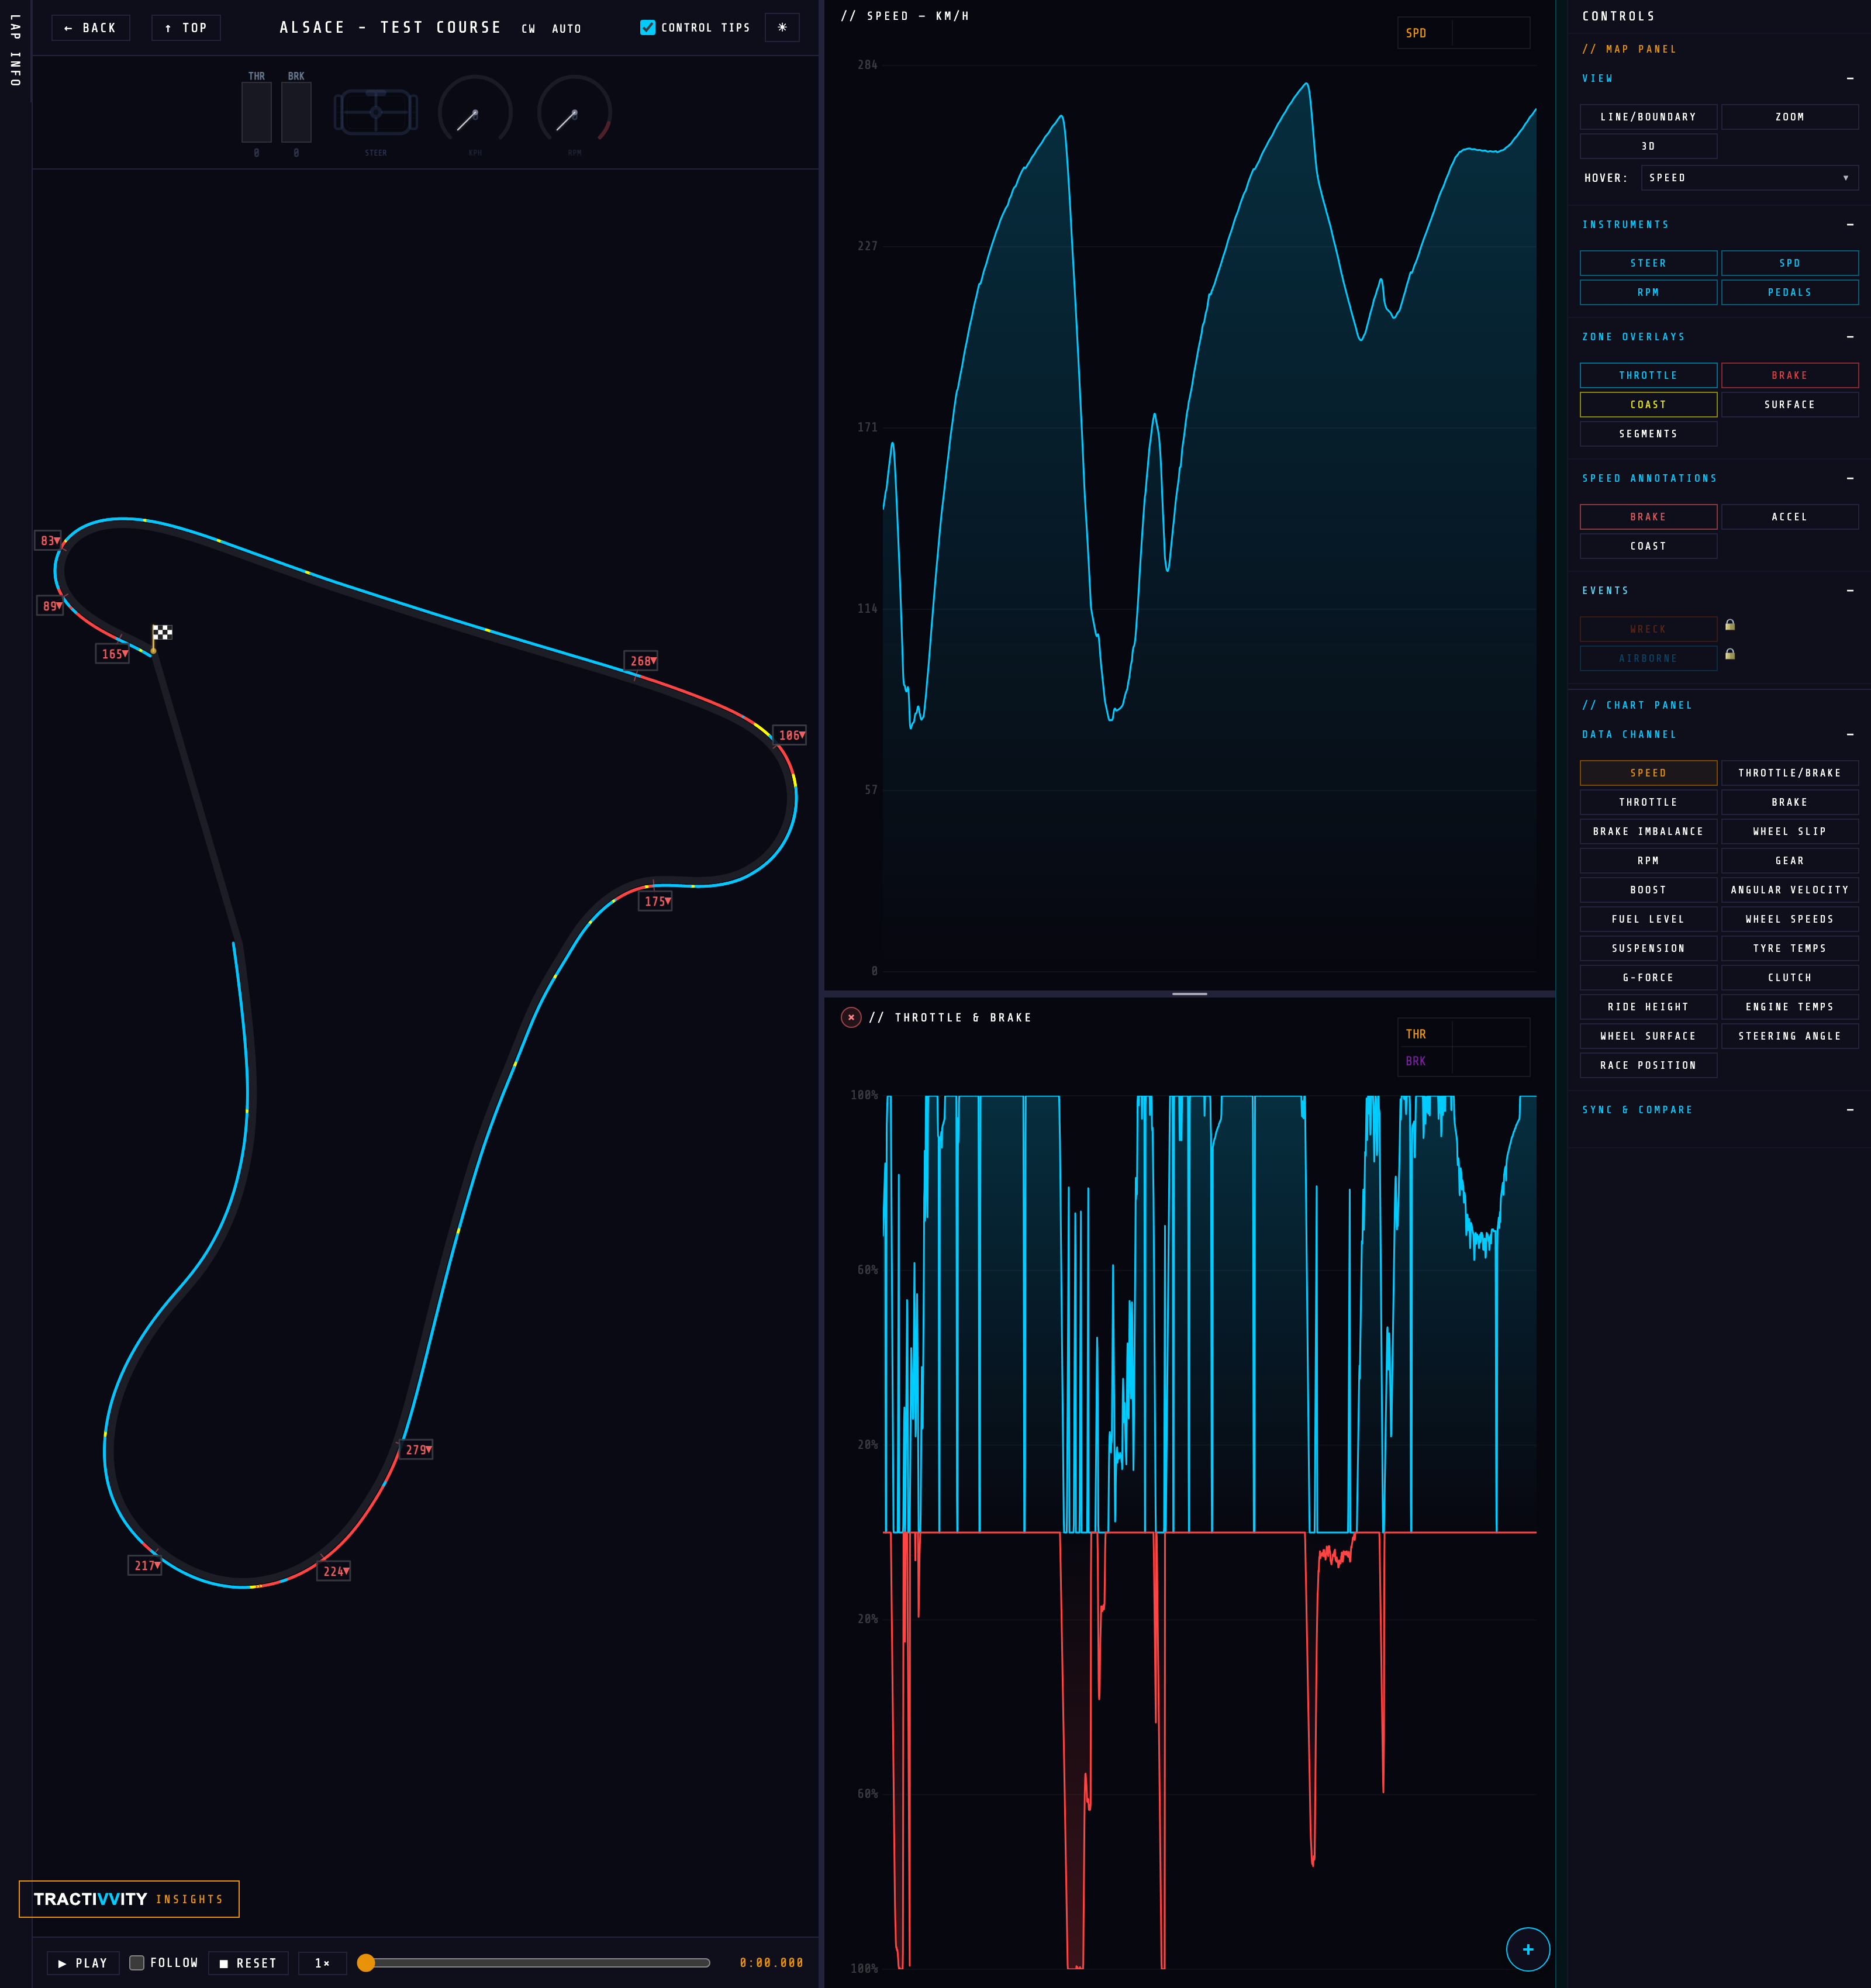
The tab on the right edge opens the control surface for the whole page. It comes in two halves: Map Panel governs the middle column, Chart Panel governs the right. Every section collapses, so you can keep open only what you are working with — and the whole thing can be moved to the top of the page instead, which is covered first below.
This is also the clearest view of the tier line anywhere in the product. Nothing is hidden from a free account — the two Pro entries sit in place with a padlock, so you can see exactly what an upgrade adds without going near a pricing page. Everything else in the drawer — every instrument, every zone overlay, every annotation and all twenty-one data channels — is yours on a free account.
Side or top — two places to put it
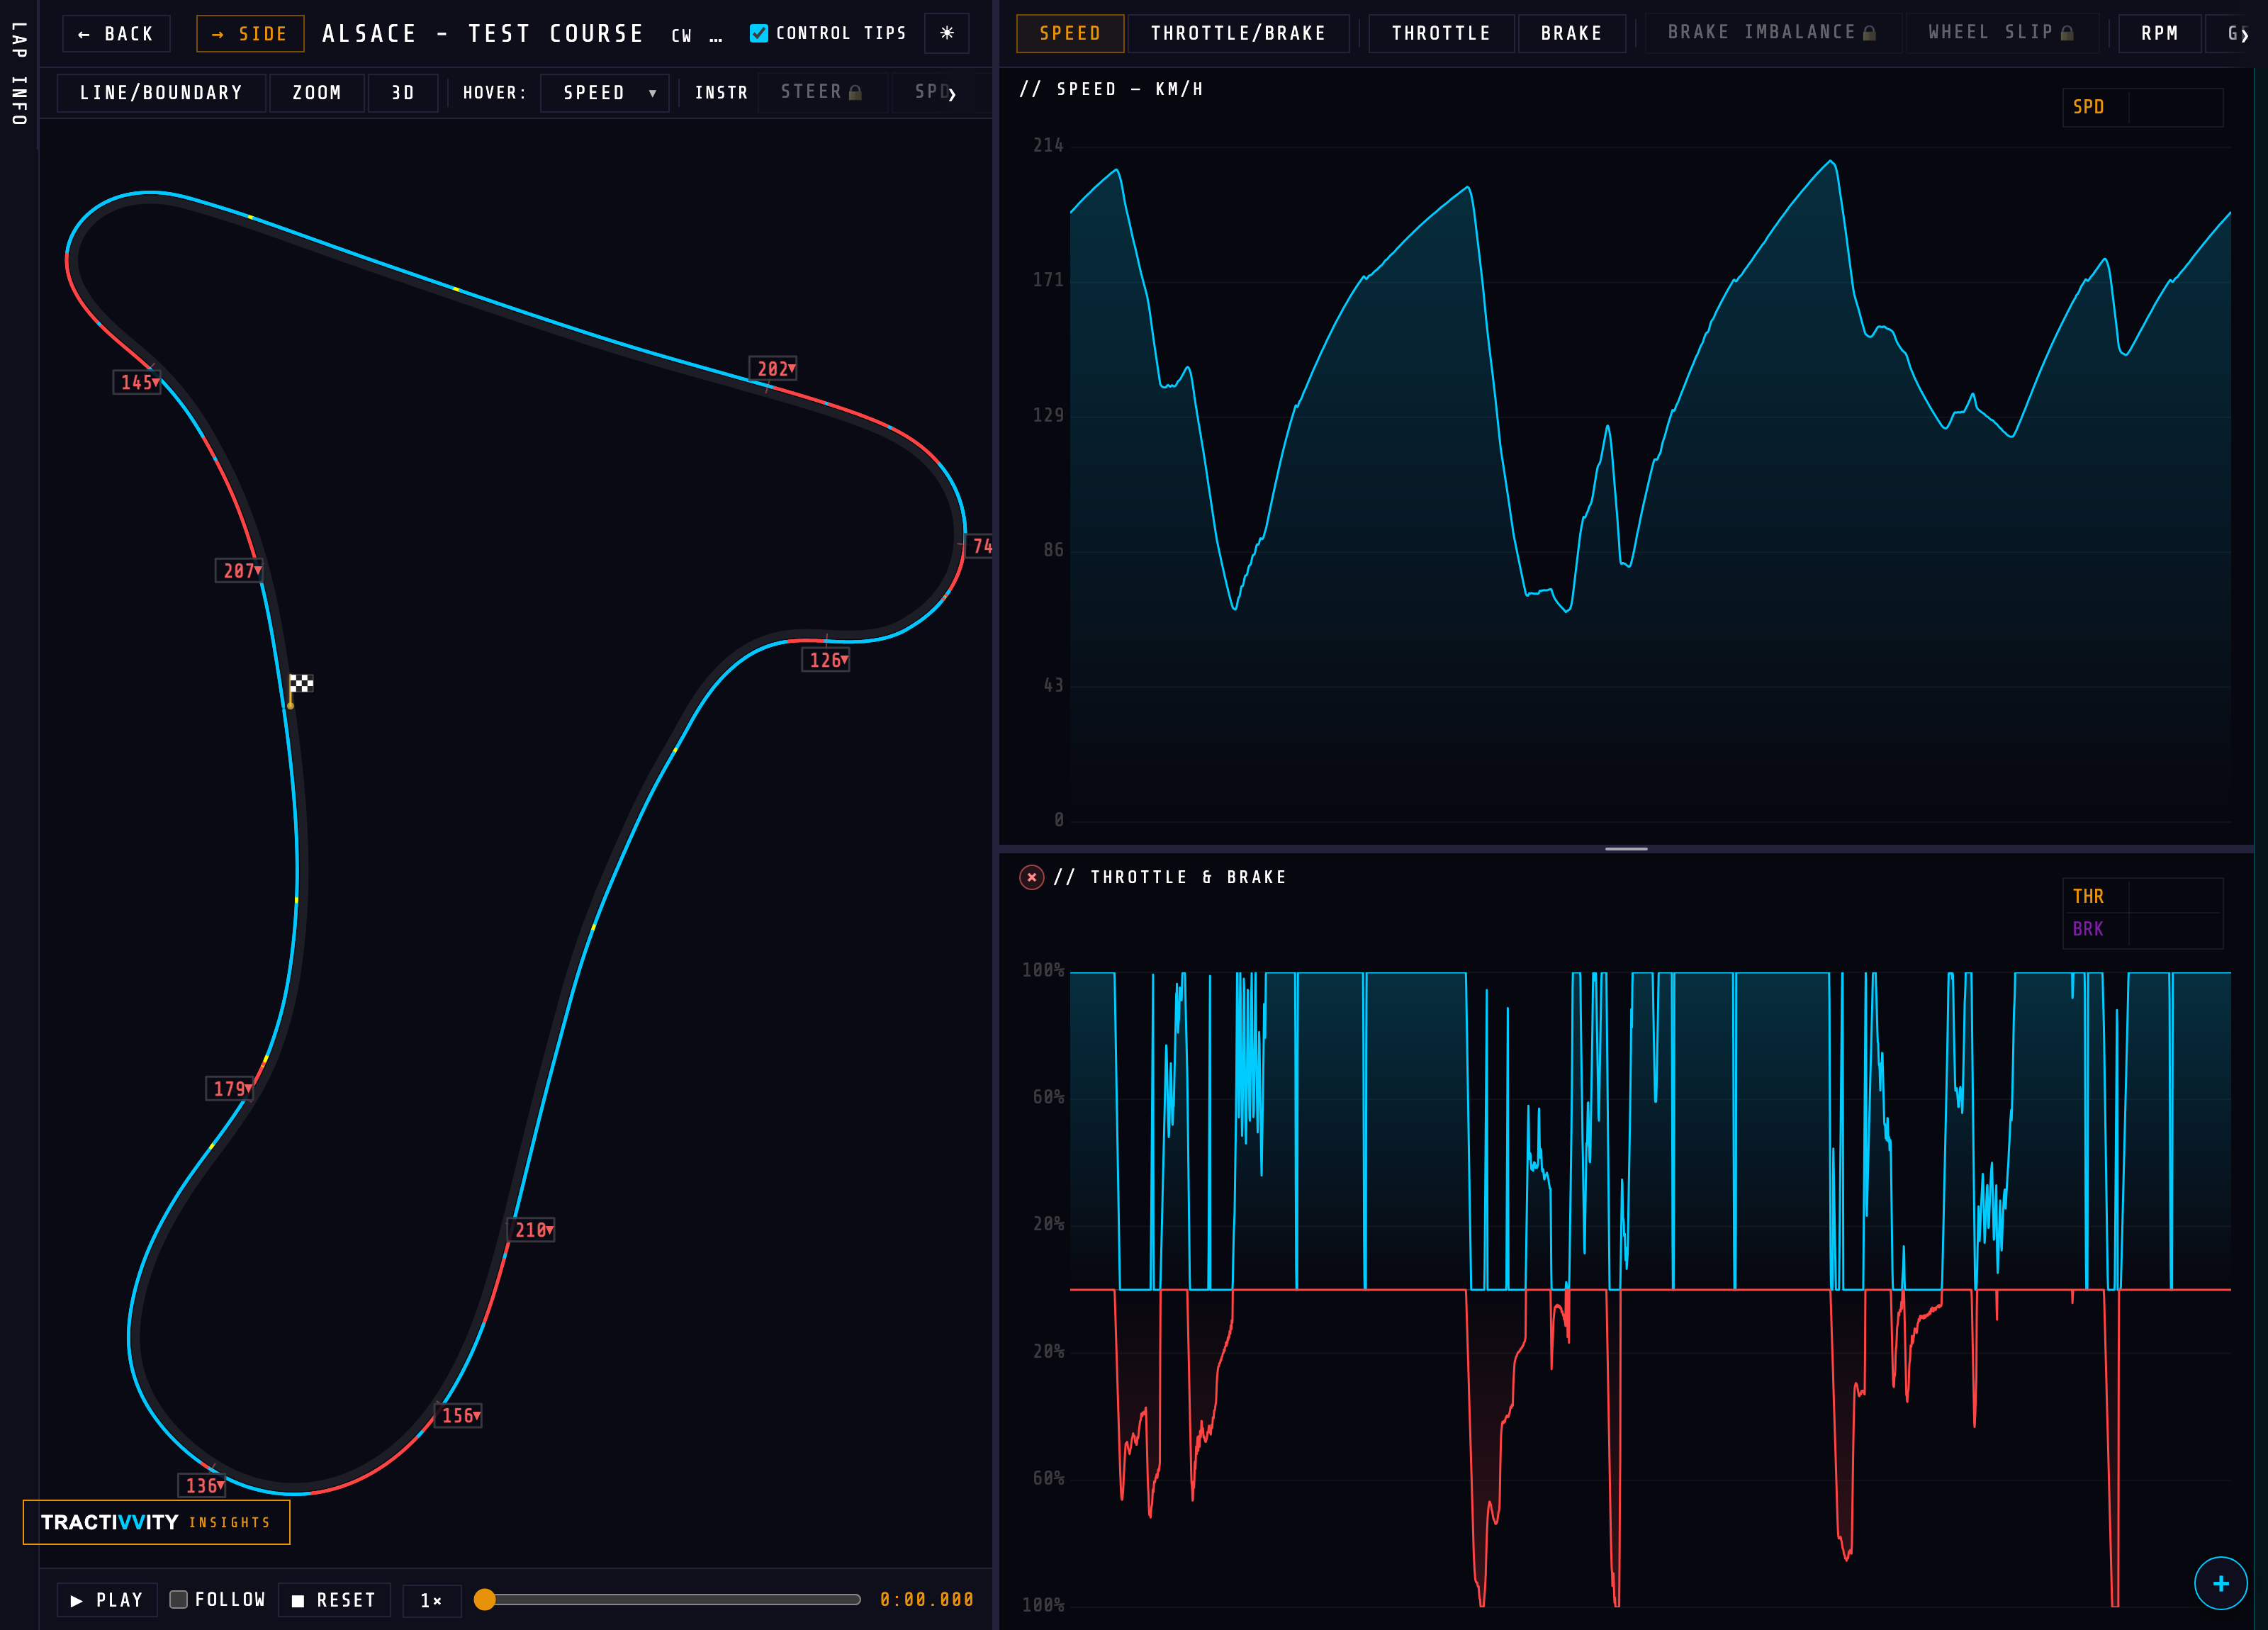
The drawer does not have to live on the right. The button in the page header toggles between the two layouts and remembers which you chose:
| Button | What you get |
|---|---|
| ↑ TOP | Move the controls to the top. They become two horizontal strips — map controls above the map, channel controls above the chart — and the right-hand column disappears. |
| → SIDE | Put them back in the sidebar on the right edge. |
The trade is straightforward. Side shows everything at once, grouped and labelled, which is what you want while you are setting the page up. Top gives the width back to the map and the chart — the strips scroll sideways rather than stacking — which is what you want once you have it configured and you are actually reading the lap.
Map Panel
View — how the circuit itself is drawn.
| Control | What it does |
|---|---|
| LINE/BOUNDARY | Switches between your racing line on its own and the line drawn inside the track boundary, so you can see how much road you actually used. |
| ZOOM | Zoom into the map. Essential on a long circuit where one corner is otherwise a few pixels wide. |
| 3D | Drops the camera to a driver's-eye view and replays the lap from the car. |
Switching to 3D rearranges the row around it: ZOOM is replaced by SIMPLE, a camera slider appears, and a DECO toggle turns the scenery on and off. The map becomes a 3D DRIVER VIEW with live speed in the corner — the lap from the seat rather than from above, with the reference line running alongside you.
Hover — a dropdown choosing what the map reports as you track along the line. Speed by default; point it at another channel and the map reads that instead.
Instruments BASIC — the gauge cluster above the map: STEER the steering wheel, SPD the speedometer, RPM the tachometer and PEDALS the throttle and brake bars. Each toggles independently, so you can keep the two you read and drop the rest.
Zone Overlays — paint the racing line by what you were doing at each point rather than leaving it one colour:
THROTTLE BRAKE COAST SEGMENTS SURFACE
Coast is the quietly useful one: switch it on and every stretch where you were on neither pedal lights up, which is usually time you did not mean to give away. Segments breaks the lap into its sectors; Surface colours the line by what the tyres were actually on.
Speed Annotations — which corner labels get printed onto the map: BRAKE ACCEL COAST. Braking points alone is the readable default; all three at once gets busy on a circuit with many corners.
Events PRO — mark incidents on the line: WRECK and AIRBORNE. The fast way to find where a lap went wrong without scrubbing the replay.
Chart Panel
Data Channel chooses what the chart plots. Twenty-one of them, and this is where most of the tier line sits.
On every account: SPEED THROTTLE/BRAKE THROTTLE BRAKE RPM GEAR GAP
With Pro: BRAKE IMBALANCE WHEEL SLIP BOOST ANGULAR VELOCITY FUEL LEVEL WHEEL SPEEDS SUSPENSION TYRE TEMPS G-FORCE CLUTCH RIDE HEIGHT ENGINE TEMPS WHEEL SURFACE STEERING ANGLE RACE POSITION
Sync & Compare closes the drawer and decides how two laps are lined up against each other: DIST by distance around the lap, TIME by elapsed time, or DELTA by the gap between them. Distance is the free option and the honest default — it puts both cars at the same point on the circuit regardless of who got there first. The same section also carries the SPLIT and HIDE BEST toggles once a compare lap is loaded.
Stacking more than one channel
One chart is rarely the whole story. Braking only means something next to speed; wheel slip only means something next to throttle. So the chart column stacks — and every row shares one distance axis, so a spike in one lines up with the same piece of track in all the others.
- Add a row. The + at the bottom right of the chart opens a channel picker — "stack another channel under the primary chart". Every channel is available to every account, here and in the main chart, so the only thing the picker greys out is what is already on screen.
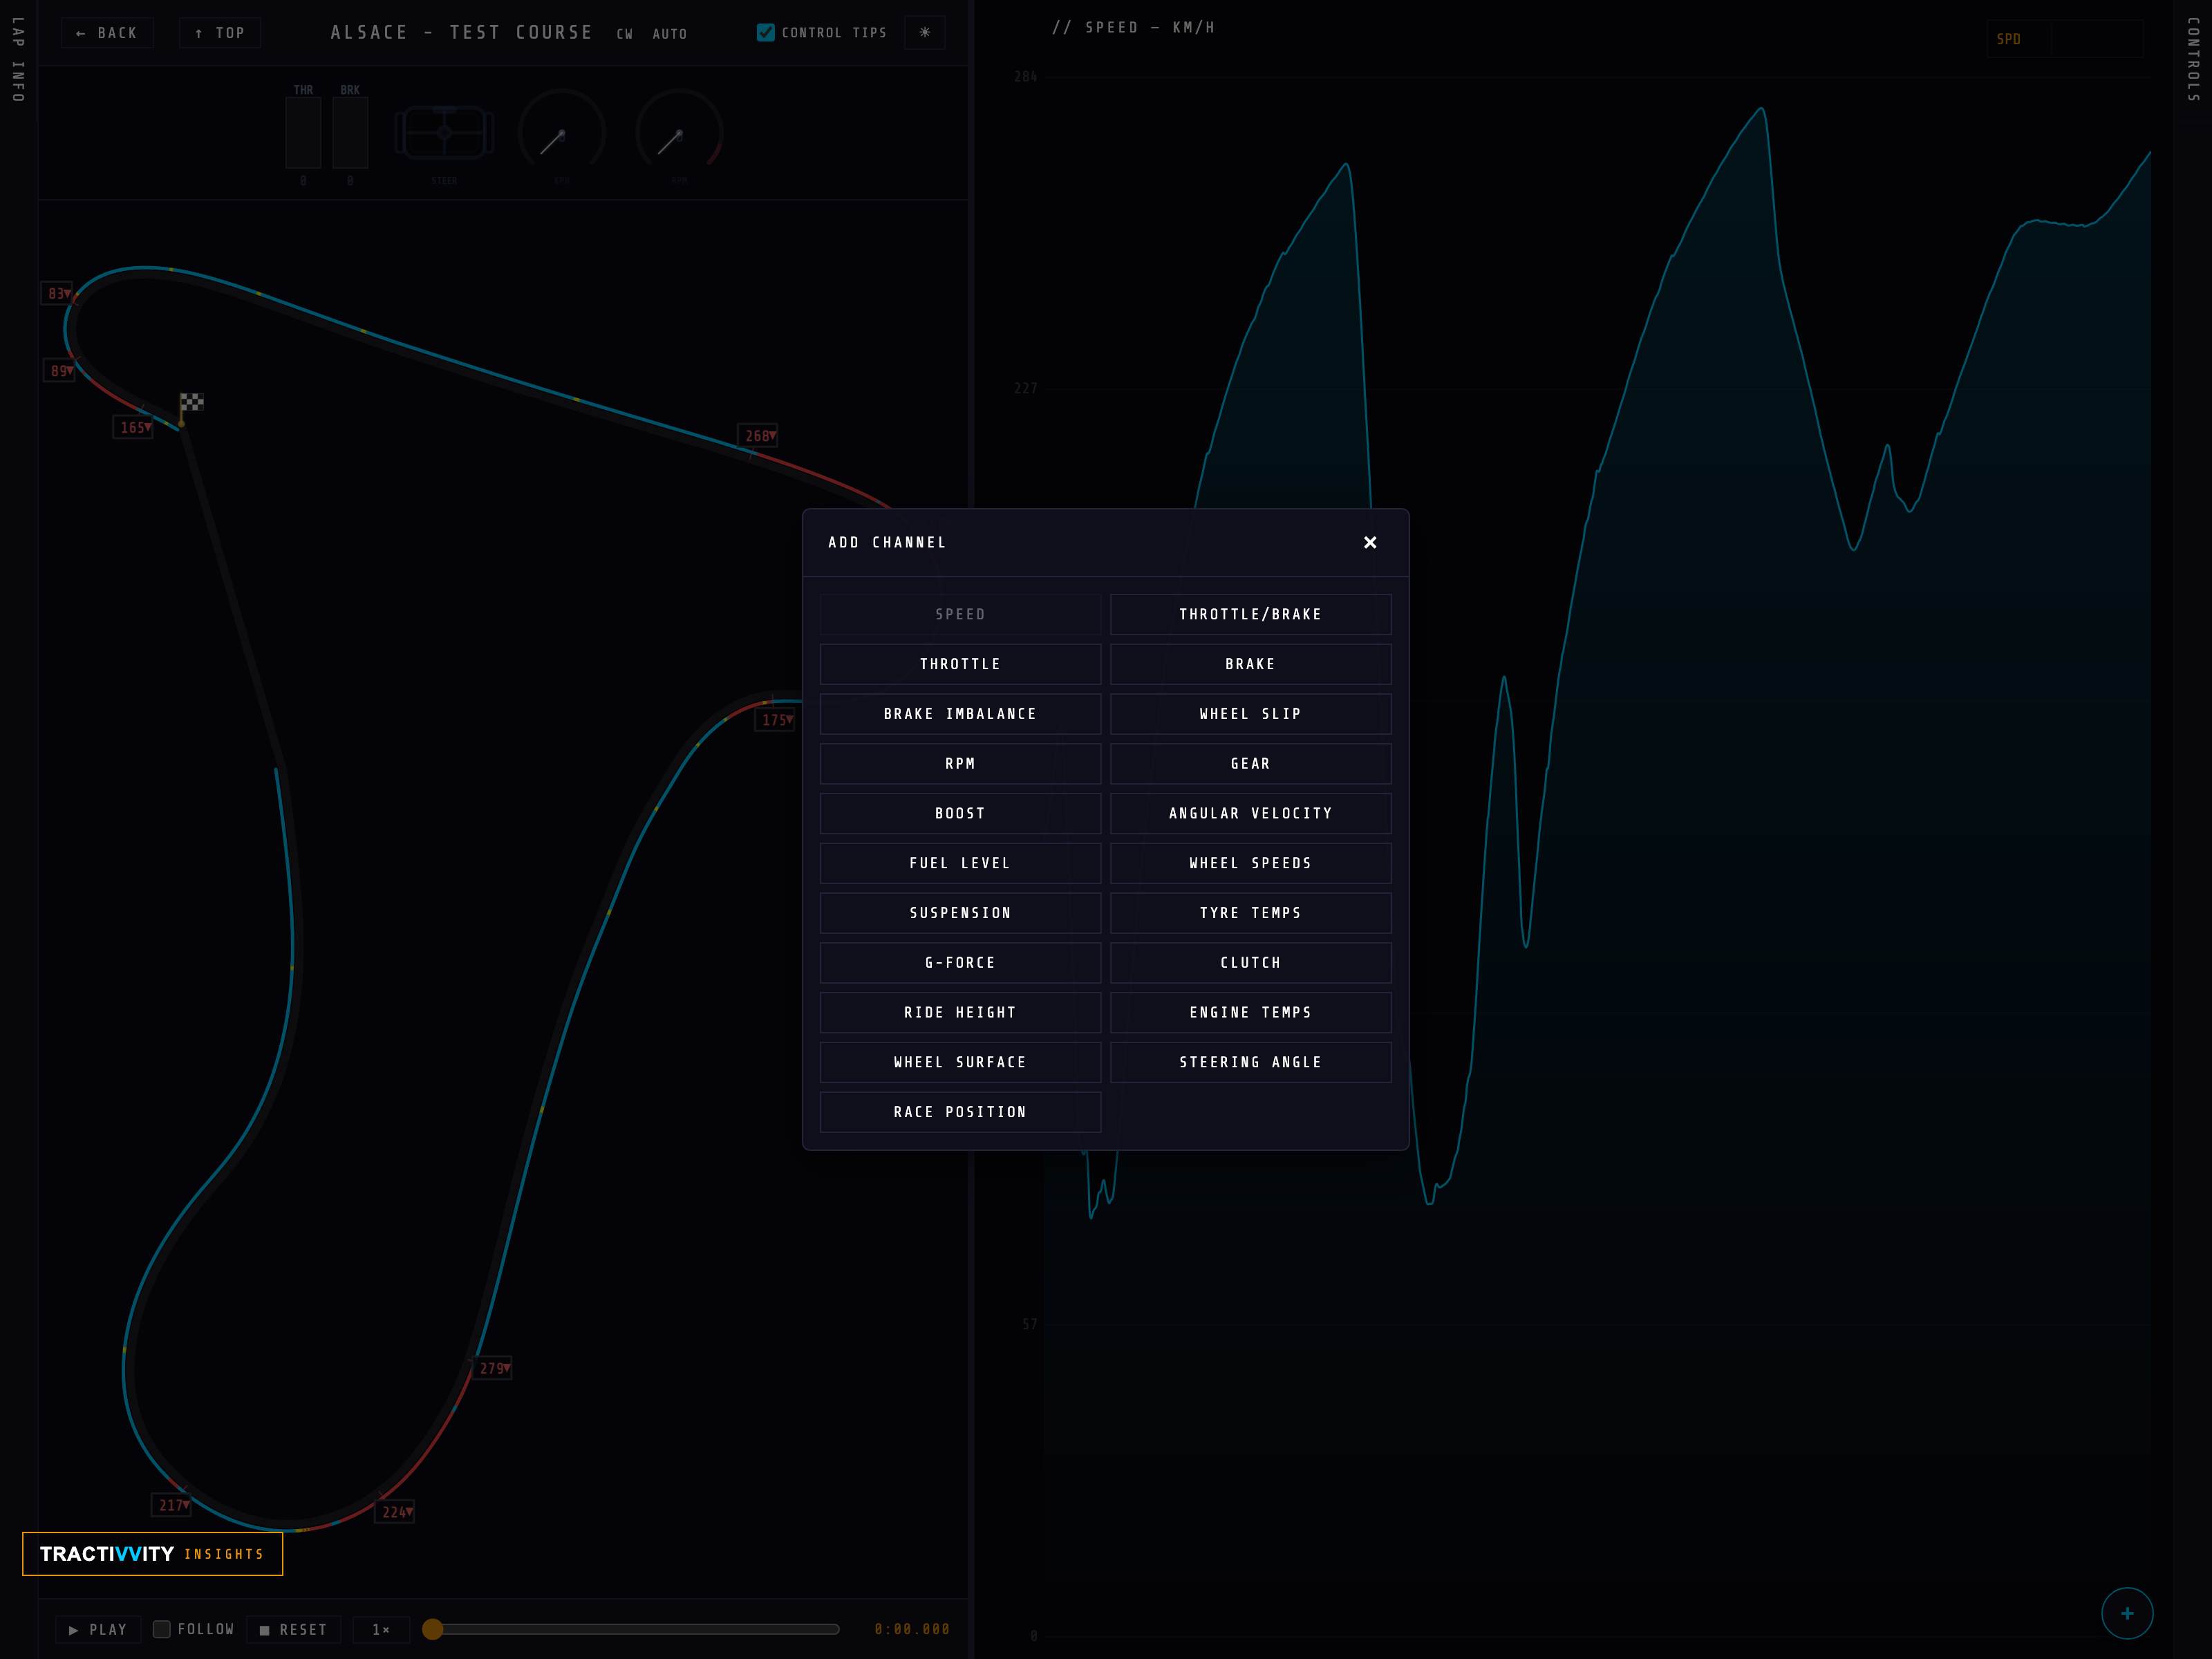
- Stack as many as you need. Each pick becomes another row underneath the primary trace, with its own header and legend.
- Resize the rows. Row heights are adjustable and remembered — give speed the space and let a supporting channel sit in a thin strip beneath it.
- Scroll the stack. Once you have more rows than fit, ↑ and ↓ move through them a row at a time rather than squeezing everything smaller.
- Remove a row with the × on its header, and the rest take the space back.
What each channel actually answers BASIC
| Channel | The question it settles |
|---|---|
| G-Force | How much grip you actually found, and where you scrubbed it away. |
| Wheel Speeds | Which wheel locked, and exactly when. |
| Wheel Slip | Where you are spinning up on exit instead of driving forward. |
| Suspension | Load balance front to rear, kerb strikes, what the car did under you. |
| Tyre Temps | Inner, middle and outer per tyre — the honest read on setup, and on you. |
| Steering Angle | Sawtoothing mid-corner, and how much correction you are feeding in. |
| Ride Height | Bottoming out, and what the aero platform is doing. |
| Boost · Clutch · Coast | Auxiliary systems, for drivers working at that level. |
| Fuel · Engine Temps | Stint planning and long-run reliability. |
| Wheel Surface | What each tyre was actually on — tarmac, kerb, grass, gravel. |
Every driver already knows they were slower. Analyze tells you where, and compare tells you by how much. Together they turn a lap you felt into a lap you can rank — corners ordered by what getting them wrong actually costs. That ordering is what makes the coach's suggestions worth acting on and a practice session worth running.
Practice Mode points this same page at a single session's laps, with a reference and a coach debrief drawn from inside that session. It is a way of working rather than a part of this screen, so it gets its own section.